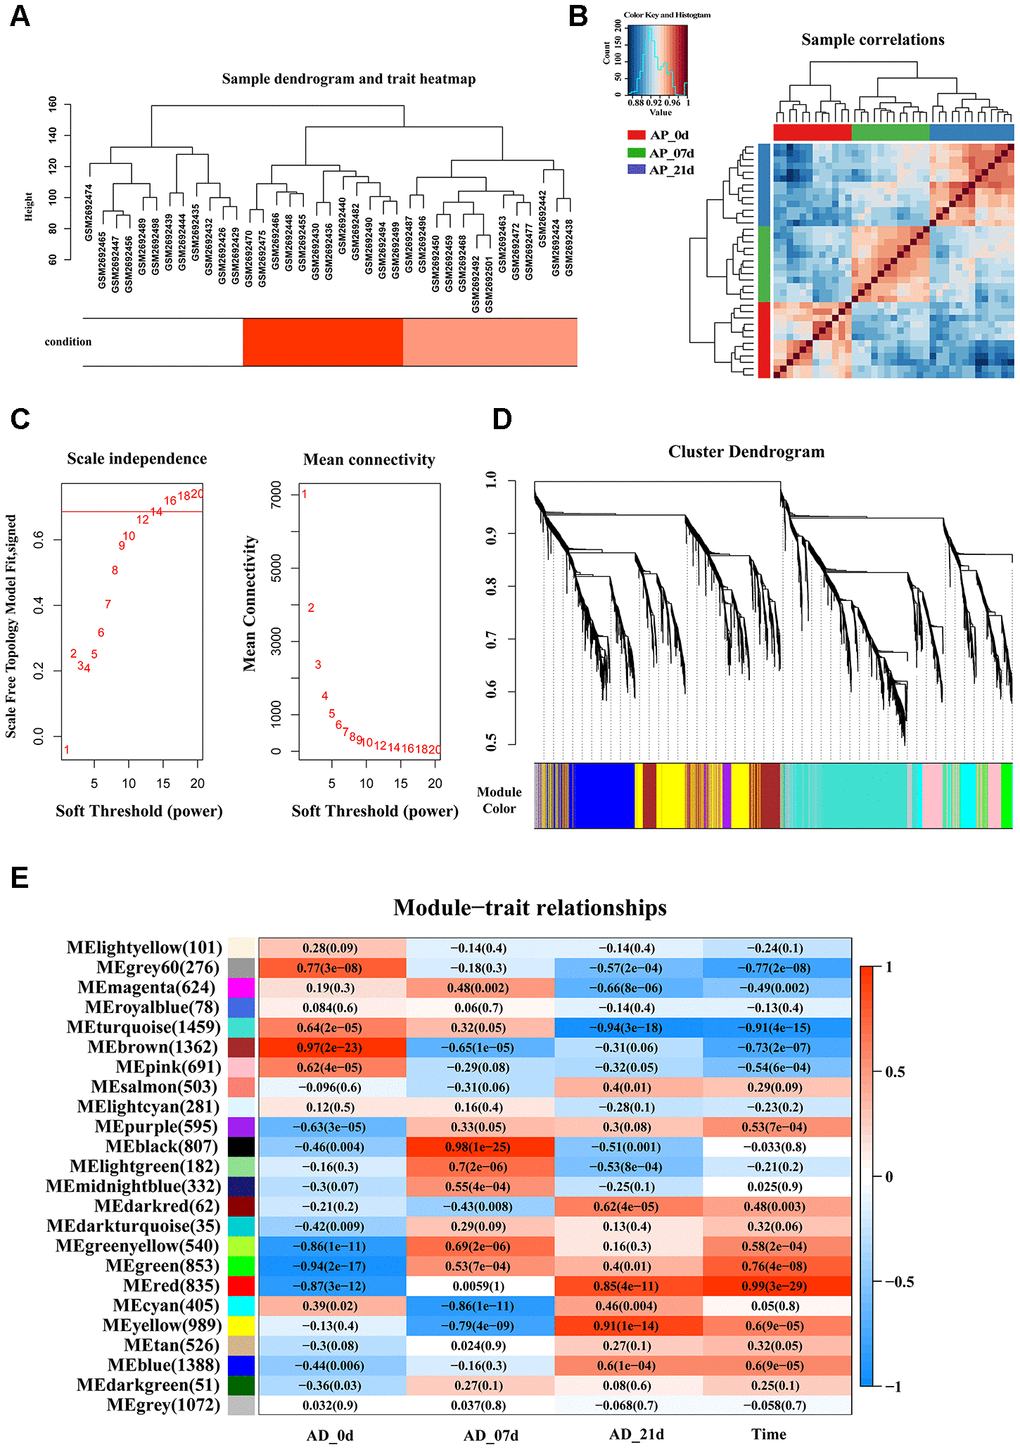
Figure 2.Identification of key modules that correlate with adipogenesis in the GEO dataset through WGCNA. (A) Sample dendrogram and trait heatmap. (B) Sample correlations among three different stages. (C) Analysis of the scale-free fit index (left) and the mean connectivity (right) for various soft-thresholding powers based on a scale-free R2 (R2 = 0.686, power = 14). (D) Dendrogram of all genes clustered based on a dissimilarity measure (1-TOM). Each branch in the dendrogram represents one gene and each module color represents one co-expression module. (E) Heatmap of the correlation between epigengene module and traits of adipogenesis. Each group contains the correlation coefficient and P value. The digits in the brackets on the left side represent the number of genes in the corresponding epigengene module.