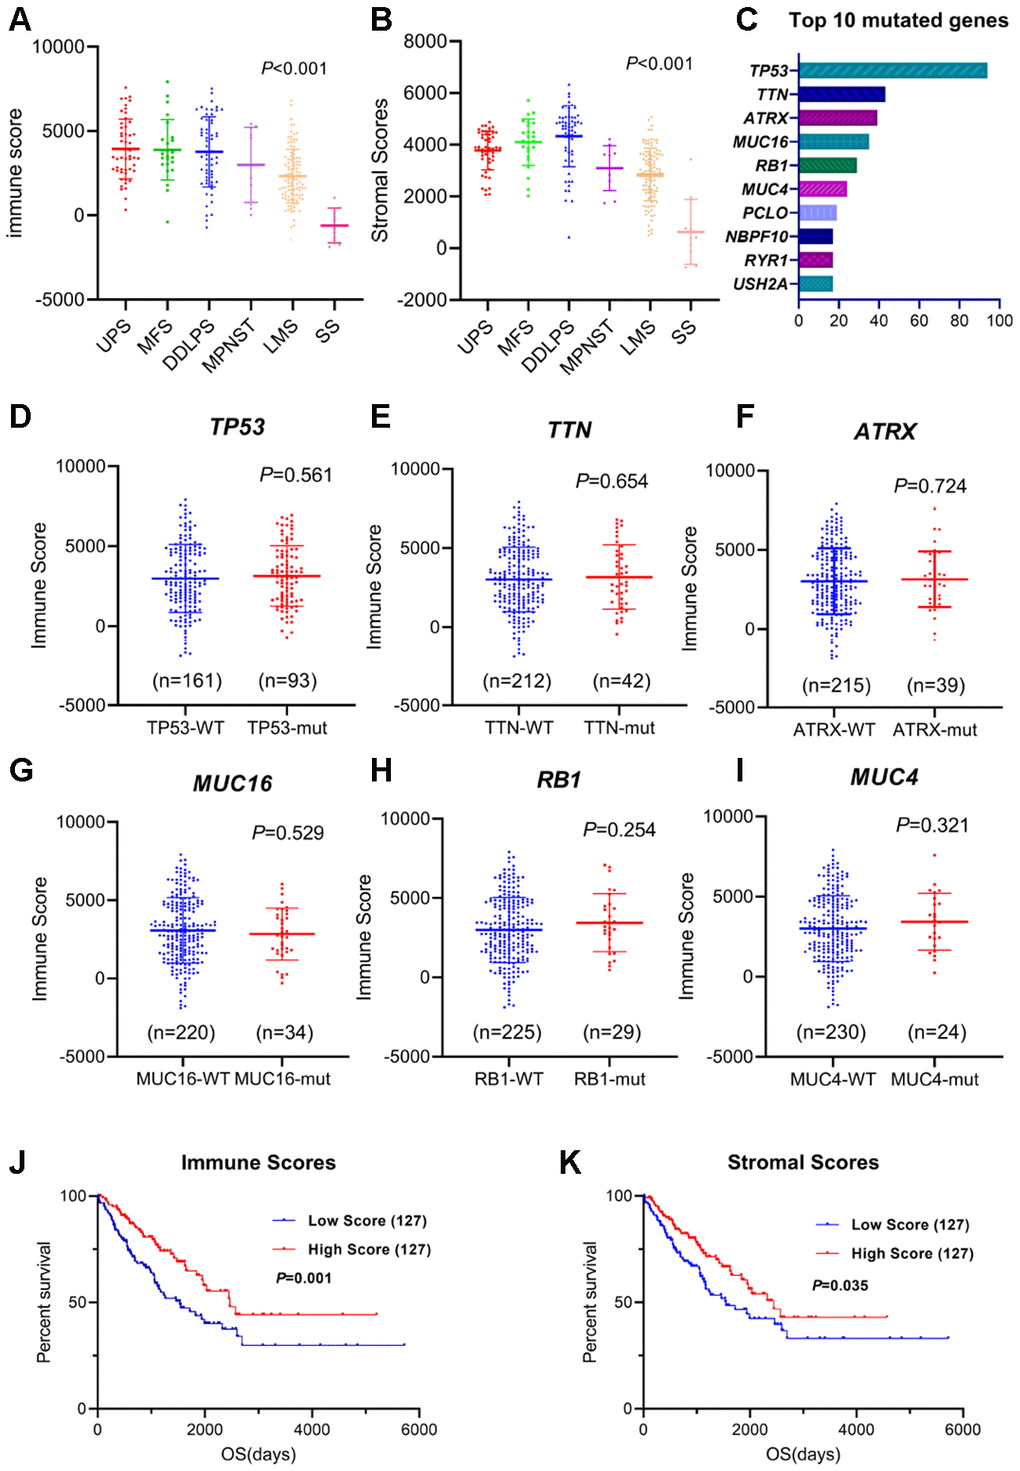
Figure 1.Immune/stromal scores of different sarcoma subtypes and survival. (A, B) Immune scores and stromal scores for different sarcoma subtypes. One-way ANOVA was applied. (C) Top 10 somatic mutation of TCGA sarcoma cohort. (D–I) Distribution of immune scores for TP53, TTN, ATRX, MUC16, RB1 and MUC4 mutant/wildtype sarcoma cases. Student's t test was applied. (J, K) The Kaplan-Meier survival curves of immune scores and stromal scores. Sarcoma cases were divided into high- and low-score groups based on the median. The sample number for each group was listed in brackets. Statistical significance was determined using the log-rank test.