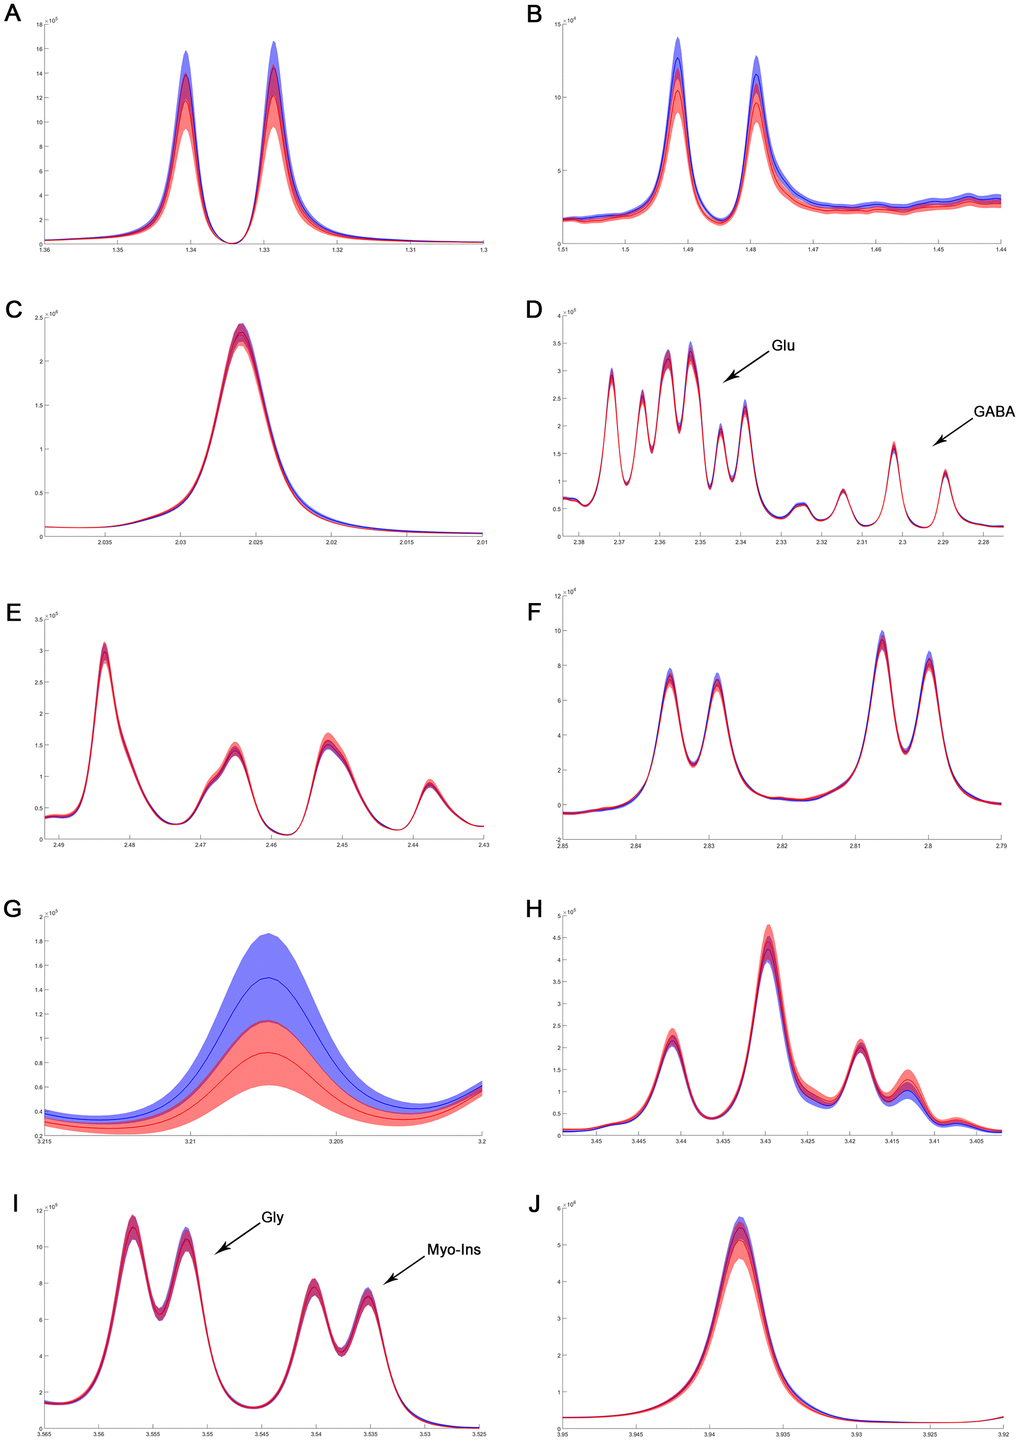
Figure 6.The difference in metabolites of normalized spectra in medulla-pons after MIRI. (A) Lactate; (B) Alanine; (C) N-acetylaspartate; (D) GABA and Glutamate; (E) Glutamine; (F) Aspartate; (G) Choline; (H) Taurine; (I) Myo-inositol and Glycine; (J) Creatinine. The spectral line and the width of its shadow represent mean and standard deviation, respectively. Control group: blue line with shadow around; IR group: red line with shadow around.