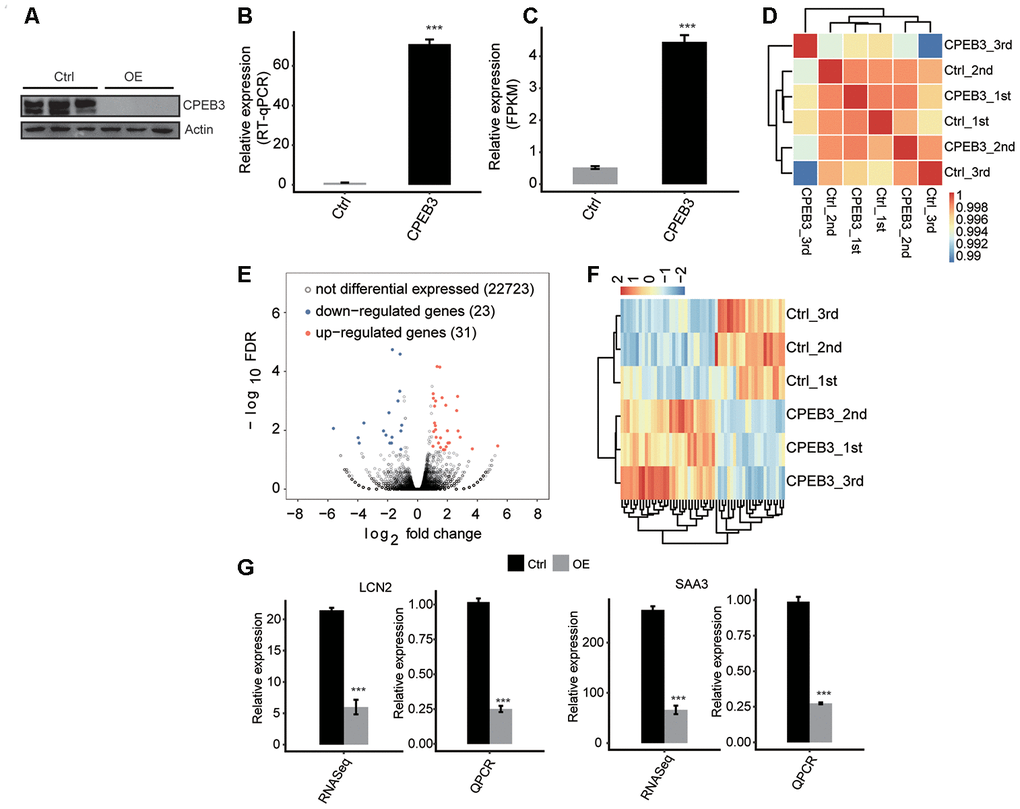
Figure 1.CPEB3 overexpression has little effect on gene expression in HT22 cells. (A) CPEB3 expression quantified by qRT-PCR. Error bars represent mean ± SEM. ***p < 0.001. (B) Western blotting analysis of CPEB3 expression. (C) CPEB3 expression quantified by RNA sequencing data. FPKM values were calculated as that has been explained in Materials and Methods. Error bars represent mean ± SEM. ***p < 0.001. (D) The heat map shows the hierarchically clustered Pearson correlation matrix resulted from comparing the transcript expression values for control and CPEB3 overexpression samples. (E) Identification of CPEB3 regulated genes. Up-regulated genes are labeled in red, whereas down-regulated are labeled in blue in the volcano plot. (F) Hierarchical clustering of DEGs in control and CPEB3 overexpression samples. FPKM values are log2-transformed and then median-centered by each gene. (G) Validation of gene expression of DEGs using qRT-PCR. RNA-seq quantification is shown at left, and RT-qPCR validation is shown at right.