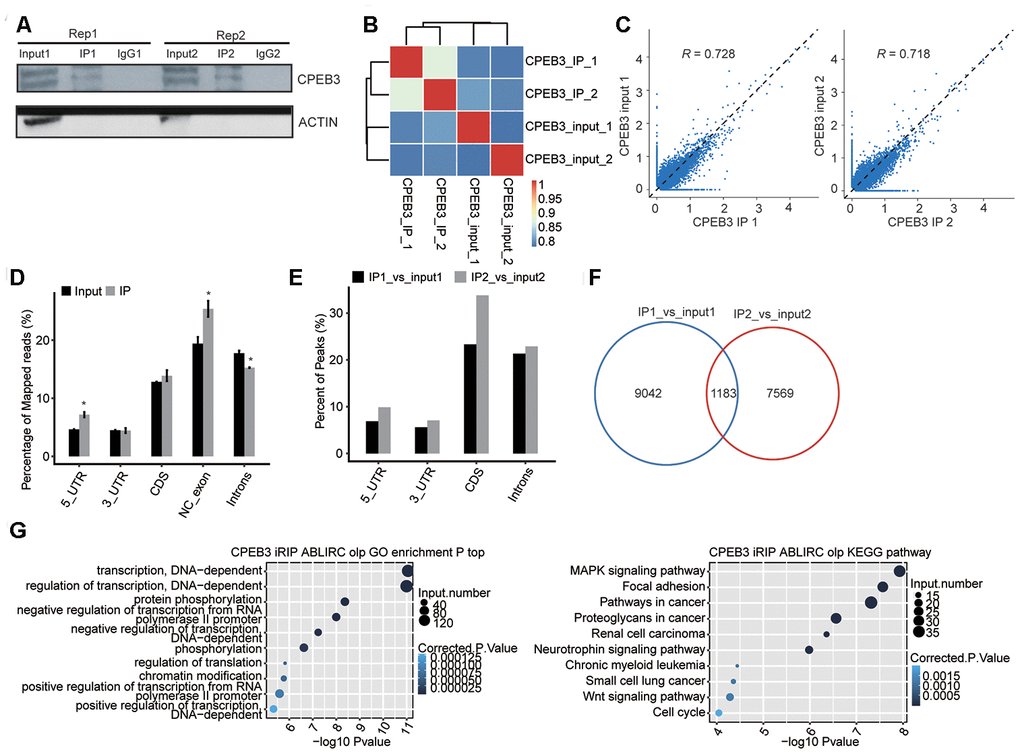
Figure 4.RIP-seq analysis of CPEB3. (A) Western blotting analysis of immunoprecipitated CPEB3 from HT22 cells. (B) The heat map shows the hierarchically clustered Pearson correlation matrix resulted from comparing the transcript abundance between anti-flag and IgG immunoprecipitated samples. (C) Scatter plot of transcript abundance across the reference genome in paired samples. (D) Reads distribution across the reference genome. Error bars represent mean ± SEM. *p < 0.05. (E) Peak distribution across different genomic regions. (F) Venn diagram of peaks in two replicates. (G) The top 10 enriched GO biological processes(left) and KEGG pathways(right) of the CPEB3-bound genes.