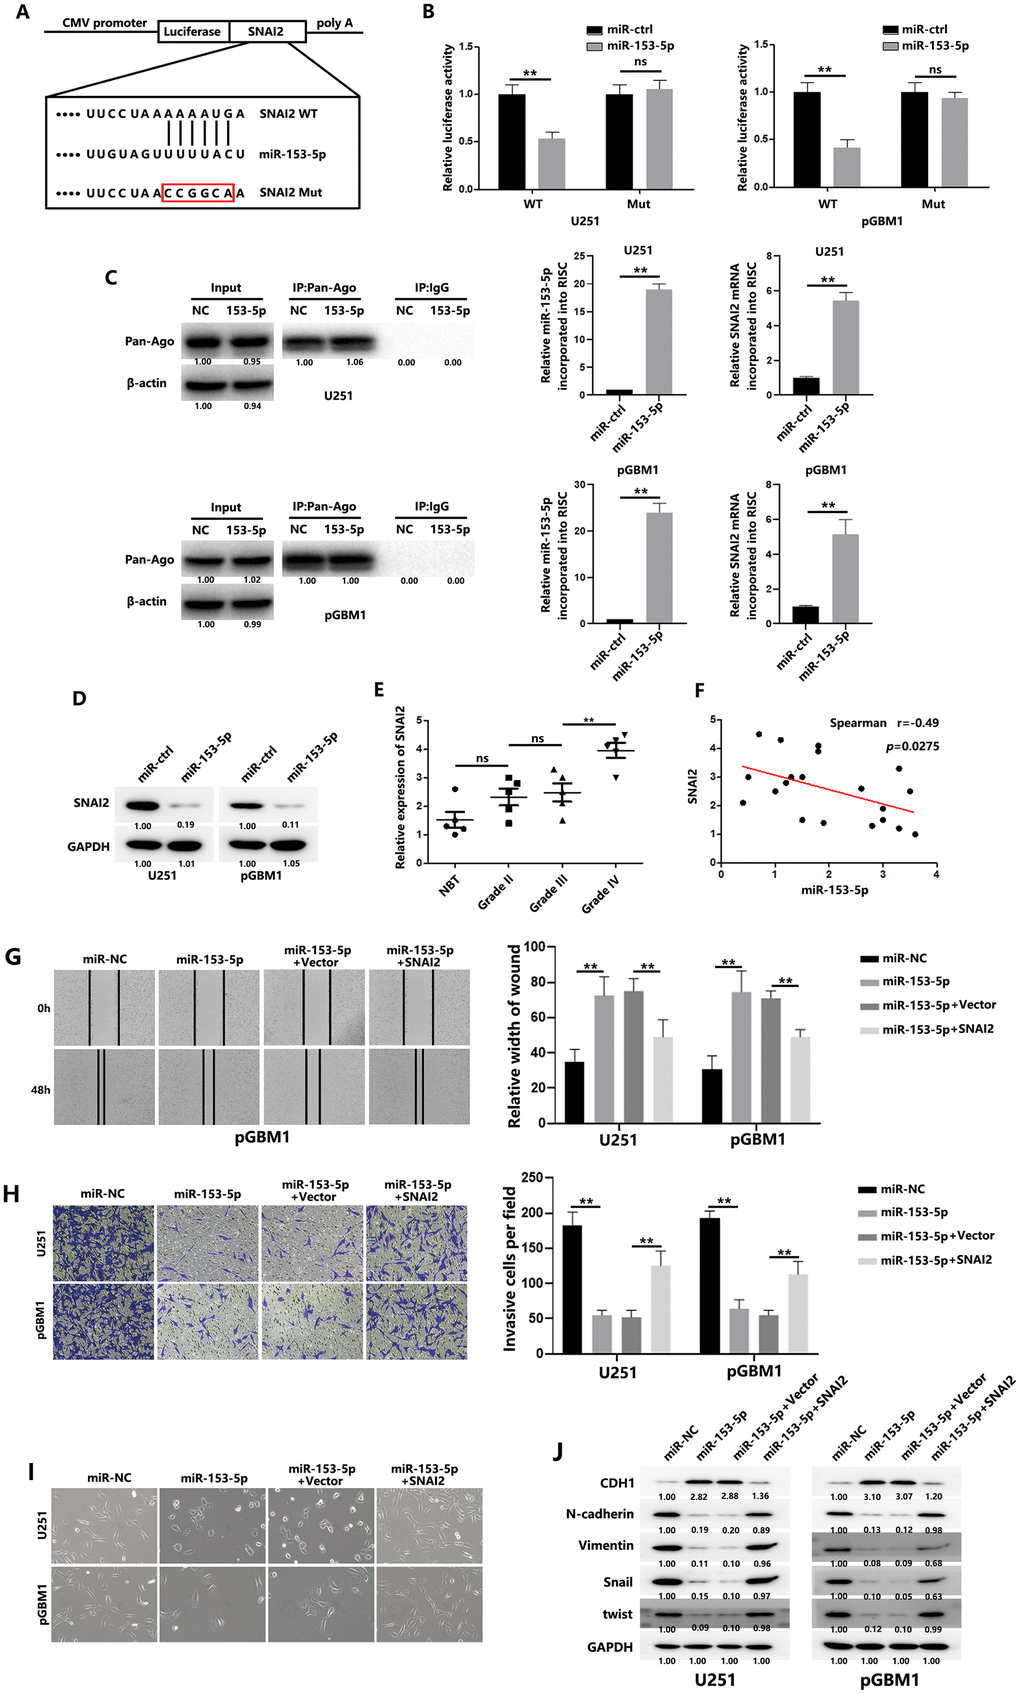
Figure 4.SNAI2 is a direct target of miR-153-5p. (A) Schematic diagram shows the predicted miR-153-5p binding sites with the 3′-UTR of SNAI2. The sequences of wild-type and mutant 3′-UTR of SNAI2 are also listed. (B) Luciferase assays were performed to measure the luciferase activity in GBM cells. (C) (Left): Immunoprecipitation of the Ago2/RISC using the Pan-Ago2 antibody in U251 or pGBM1 cells overexpressing miR-NC or miR-153-5p. IgG was used as a negative control, and β-actin was used as an internal control. (Middle): qRT-PCR analysis of miR-153-5p incorporated into RISC in U251 or pGBM1 cells overexpressing miR-153-5p compared to the levels in the control. U6 RNA was used as an internal control. (Right): qRT-PCR of SNAI2 incorporated into RISC in U251 or pGBM1 cells overexpressing miR-153-5p. GAPDH RNA was used as an internal control. (D) Western blot analysis indicated that SNAI2 expression levels were decreased in cells with miR-153-5p overexpression. (E) SNAI2 expression levels in 5 normal brain tissues and 15 glioma specimens (5 glioma tissues in each group: WHO grades II, III, and IV) were examined using qRT-PCR. (F) Spearman correlation analysis was used to confirm the correlation between the SNAI2 and miR-153-5p levels in 20 human glioma specimens. (G) Wound healing assays were used to analyze migration of GBM cells. (H) Matrigel invasion assays were used to analyze invasion of GBM cells. (I) Morphological changes of GBM cells were imaged to analyze EMT process of GBM cells. (J) EMT-associated proteins in GBM cells were determined by western blotting. *P < 0.05, **P < 0.01.