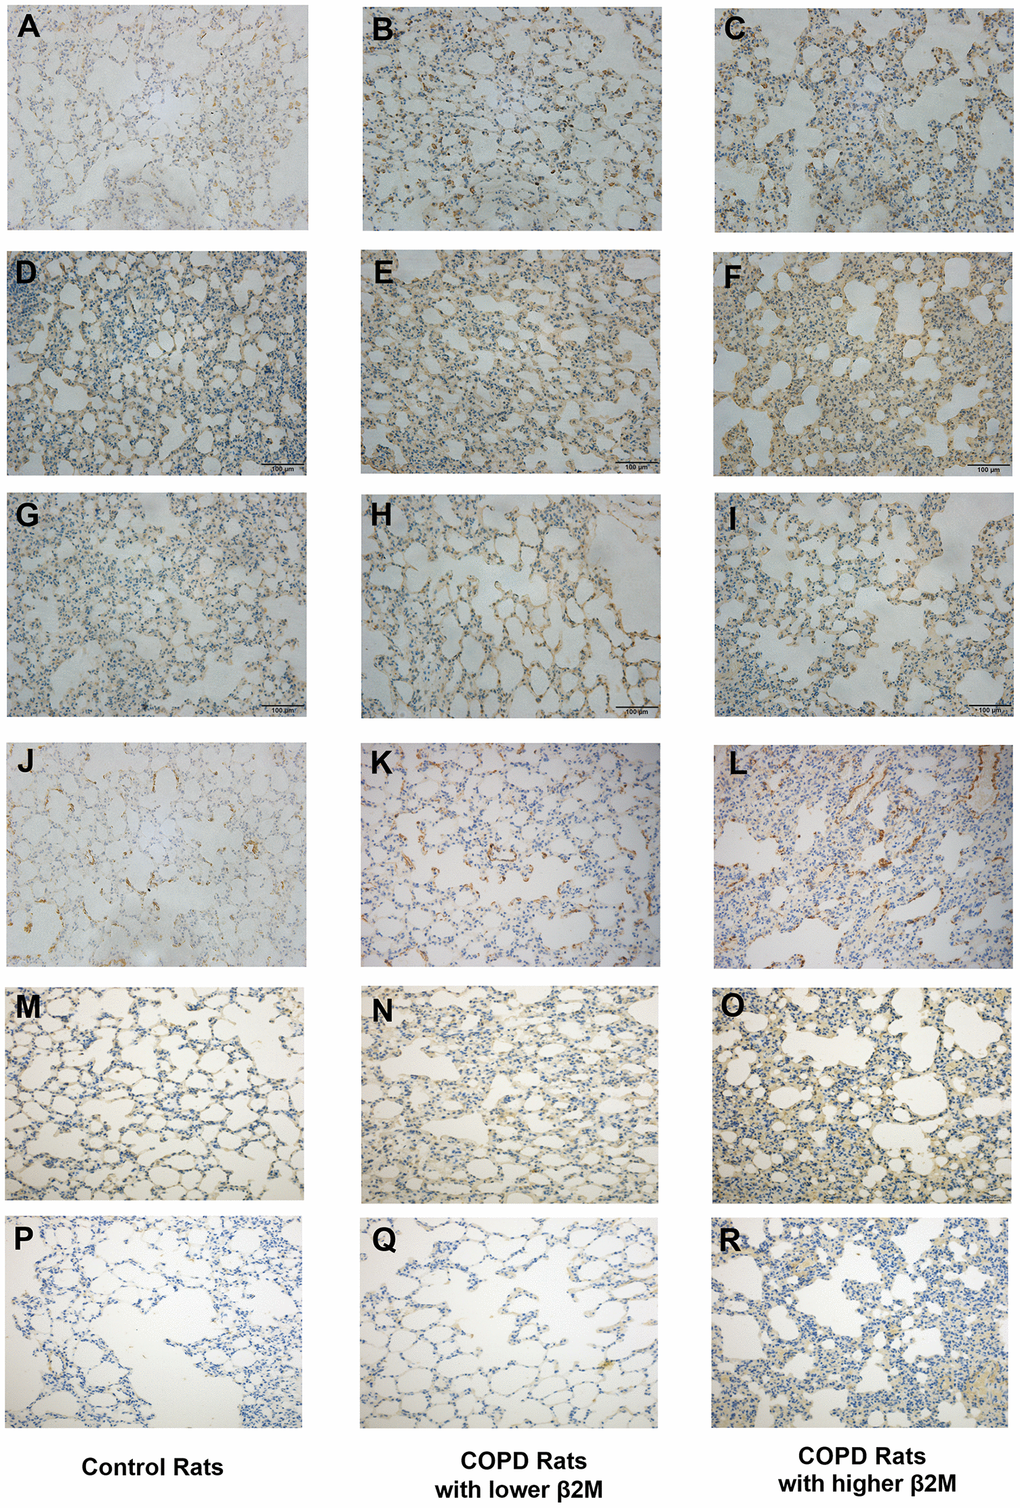
Figure 4.Immunohistochemical staining of lung tissue from rats. Lung tissue of control rats including (A, D, G, J, M, P); lung tissue of COPD rats with lower β2M including (B, E, H, K, N, Q); lung tissue of COPD rats with higher β2M including (C, F, I, L, O, R). Indicators and positive cell rate: (A–C) Representative image of β2M immunohistochemical staining of lung tissue from control rats (7.29 ± 1.65%), COPD rats with lower β2M (14.39 ± 2.17%) and COPD rats with higher β2M (21.21 ± 2.56%) respectively. (D–F) Representative image of TGF-β1 immunohistochemical staining of lung tissue from control rats (30.12 ± 3.24%), COPD rats with lower β2M (33.22 ± 2.87%) and COPD rats with higher β2M (37.30 ± 4.99%) respectively. (G–I) Representative image of Smad4 immunohistochemical staining of lung tissue from control rats (20.67 ± 2.25%), COPD rats with lower β2M (27.04 ± 2.99%) and COPD rats with higher β2M (29.51 ± 3.14%) respectively. (J–L) Representative image of a-SMA immunohistochemical staining of lung tissue from control rats (5.82 ± 0.57%), COPD rats with lower β2M (7.99 ± 1.35%) and COPD rats with higher β2M (9.96 ± 3.10%) respectively. (M–O) Representative image of col1 immunohistochemical staining of lung tissue from control rats (8.43 ± 2.58%), COPD rats with lower β2M (13.19 ± 7.05%) and COPD rats with higher β2M (19.67 ± 7.46%) respectively. (P–R) Representative image of col3 immunohistochemical staining of lung tissue from control rats (12.53 ± 8.96%), COPD rats with lower β2M (12.57 ± 7.06%) and COPD rats with higher β2M (22.04 ± 10.14%) respectively. The pictures show the same differential tendency (P<0.05).