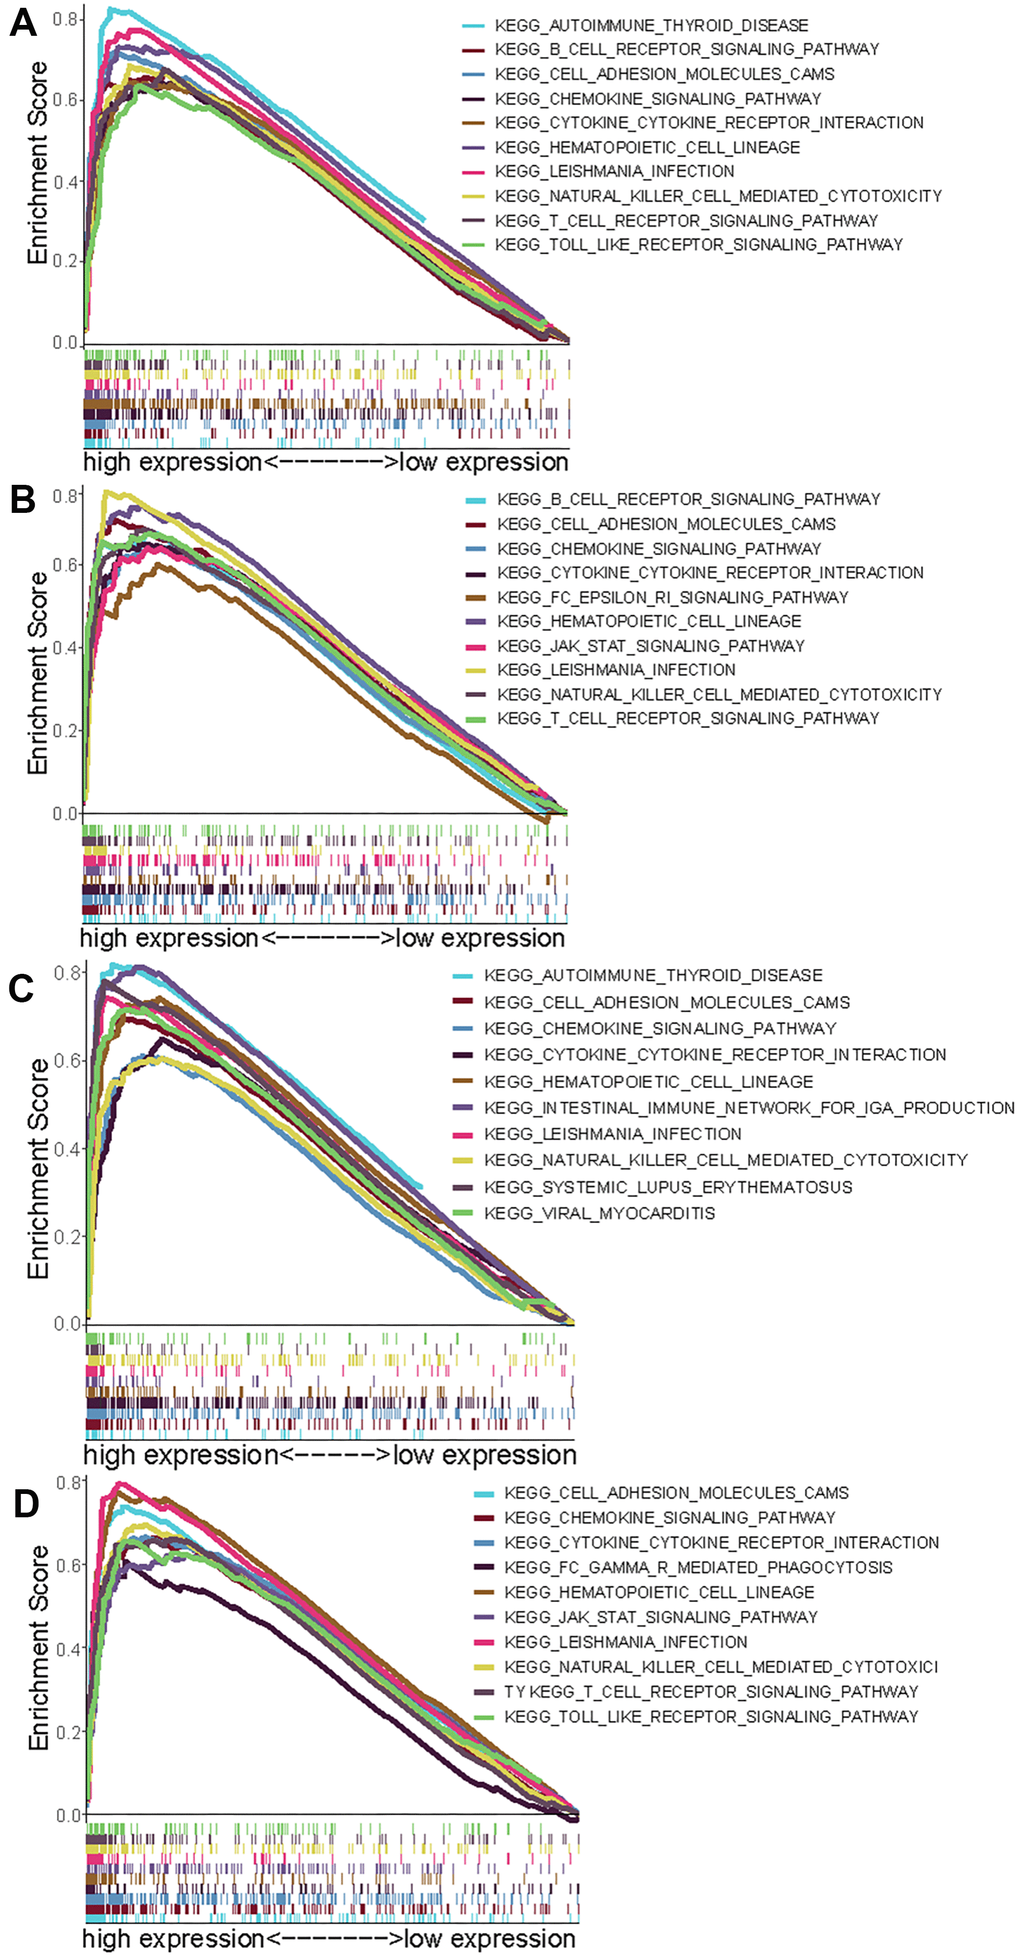
Figure 5.Select GSEA plots of signatures for the four genes. (A) Enriched gene sets in KEGG collection by high expression of CCR2 (A), CCR4 (B), P2RY12 (C), and P2RY13 (D). Each line with a unique color represents one particular gene set. The upregulated genes are located on the left of the x-axis, and the downregulated genes are on the right. Only the gene sets with FDR q < 0.05, NOM p < 0.05, and FWER p < 0.05 are displayed. The top 10 leading gene sets are presented in the plot.