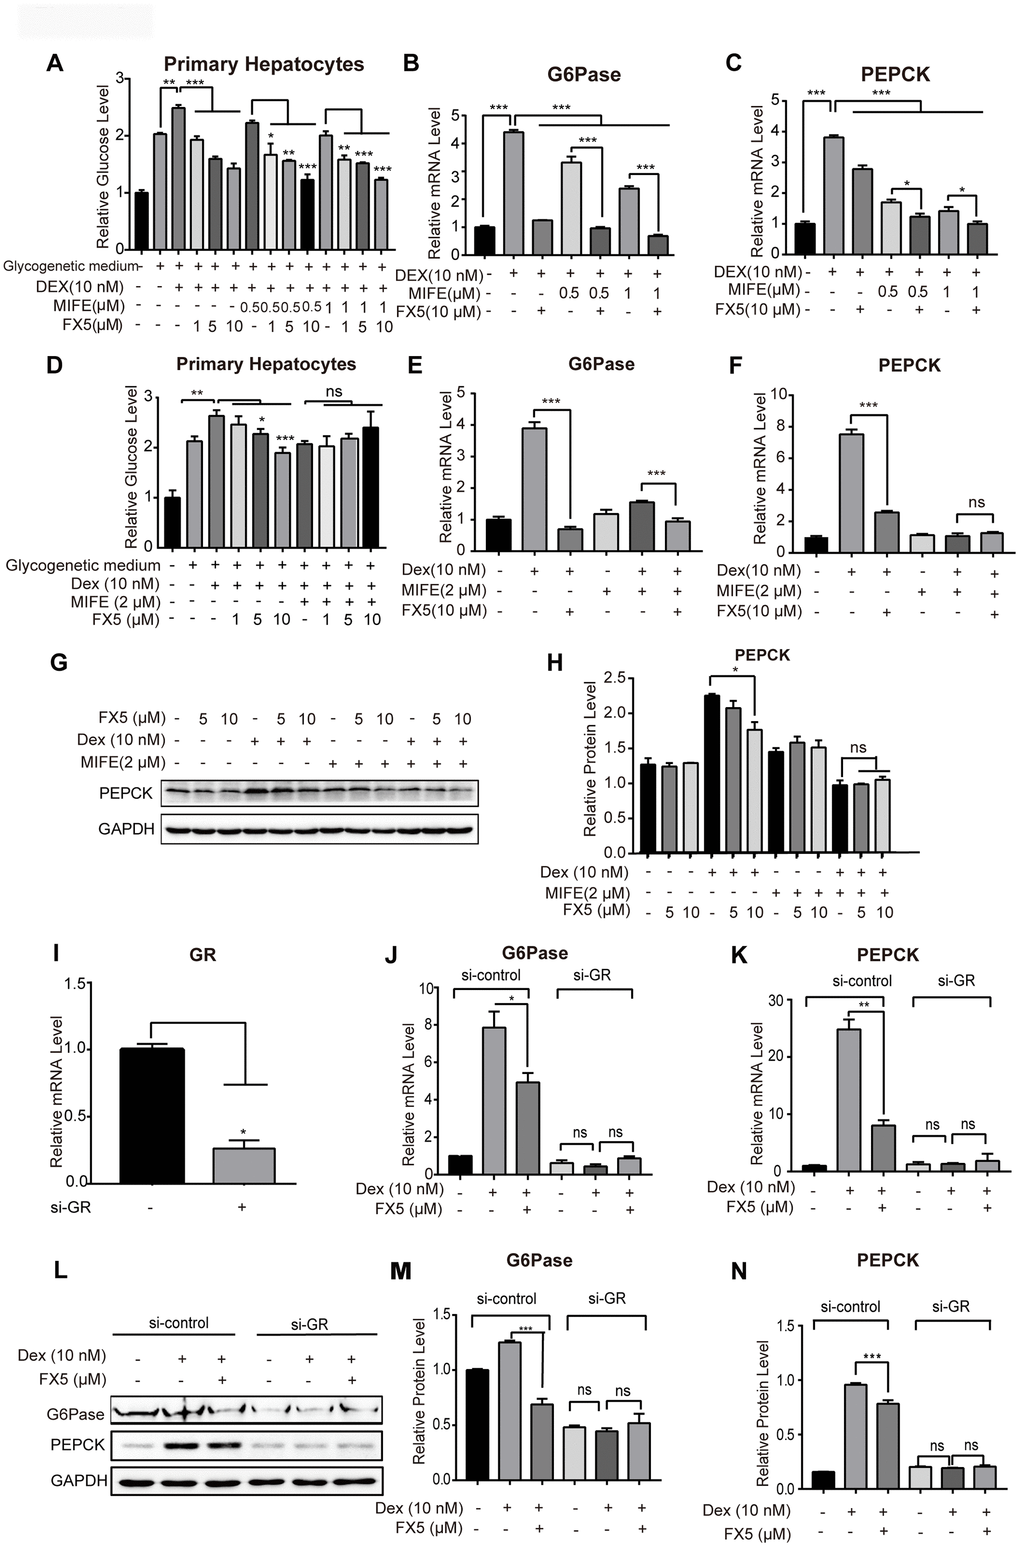
Figure 3.FX5 suppressed gluconeogenesis by antagonizing GR. (A) Glucose production assay was conducted in mouse primary hepatocytes. Cells were pretreated with glucagon (10 nM) and different concentration of mifepristone (MIFE) (0.5 and 1 μM) for 12 h, and then cultured for another 6 h in glycogenetic medium with glucagon and different concentrations of FX5 (1, 5 and 10 μM). Finally, glucose level in the medium was measured. (B, C) Mouse primary hepatocytes were treated with 10 nM Dex, MIFE (0.5 or 1 μM) and 10 μM FX5 for 6 h. Then, mRNA levels of G6Pase and PEPCK were measured by qRT-PCR. (D) Primary hepatocytes were pretreated with Dex (10 nM), mifepristone (MIFE) (2 μM) and different concentrations of FX5 (1, 5, 10 μM). Glucose level in the medium was measured. (E, F) Mouse primary hepatocytes were treated with 10 nM Dex, 2 μM MIFE and 10 μM FX5 for 6 h. Then, the effect of FX5 on expressions of G6Pase (82% to 39%) and PEPCK (66% to no significance) were repressed by MIFE by quantitative RT-PCR assay. (G) Mouse primary hepatocytes were incubated with 10 nM Dex, 2 μM MIFE and different concentrations of FX5 (5, 10 μM) for 6 h, and protein levels of PEPCK and GAPDH were measured by western blot and quantified in (H). (I–N) Mouse primary hepatocytes were transfected with si-control or si-GR for 48h. Hepatocytes were then treated with 10 nM Dex and 10 μM FX5 for 6 h. (I) The mRNA interference efficiency level of GR by si-GR was 73.6%. mRNA levels of (J) G6Pase and (K) PEPCK were measured by quantitative RT-PCR. (L) Protein levels of G6Pase, PEPCK and GAPDH were measured by western blot assay. Quantification of (M) G6Pase and (N) PEPCK protein levels. All results were normalized to GAPDH. Values were mean ± S.E.M (n=3/group) (*P<0.05, **P<0.01 and ***P<0.001).