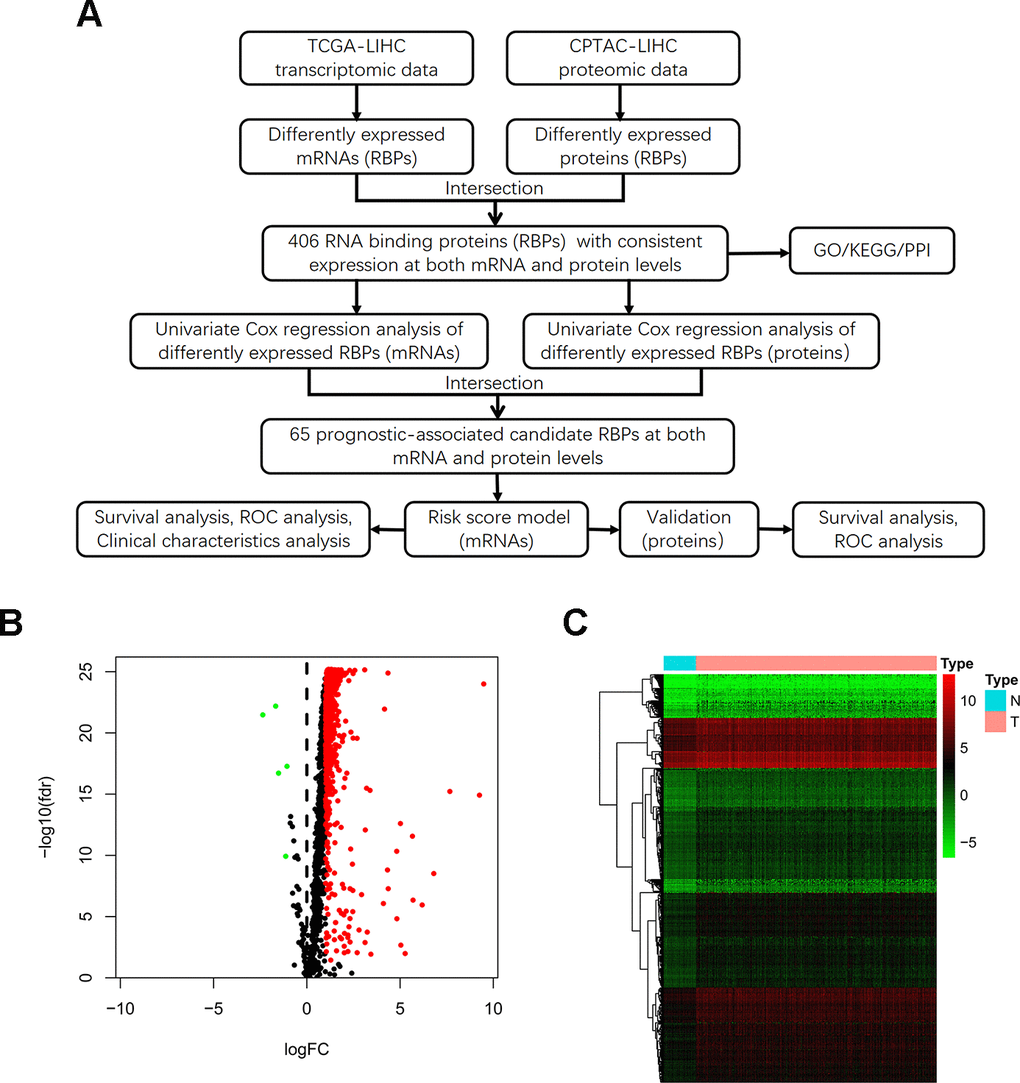
Figure 1.Identification of differentially expressed RBPs between HCC tumor and normal tissues. (A) Flow chart for analysis of RBPs in HCC. (B) Volcano plot for RBPs. Red indicates high expression while green indicates low expression. Black indicates genes that had no differences between HCC tumor and normal tissues. (C) Hierarchical clustering analysis of differentially expressed RBPs. The columns indicate samples and the rows are RBPs. Blue represents downregulation while red represents upregulation.