Submit an Article
Navigate
Home
Editorial Board
Editorial Policies
Current Volume
Archive
Scientific Integrity
Publication Ethics Statements
Interviews with Outstanding Authors
Newsroom
Sponsored Conferences
Podcast
Contact
Special Collections
Submit an Article
Online ISSN: 1945-4589
Research Paper
|
Volume 13, Issue 2
|
pp. 2480–2505
Integrated bioinformatic analysis of RNA binding proteins in hepatocellular carcinoma
Back to article
Figure 2
(2 of 13)
−
100%
+
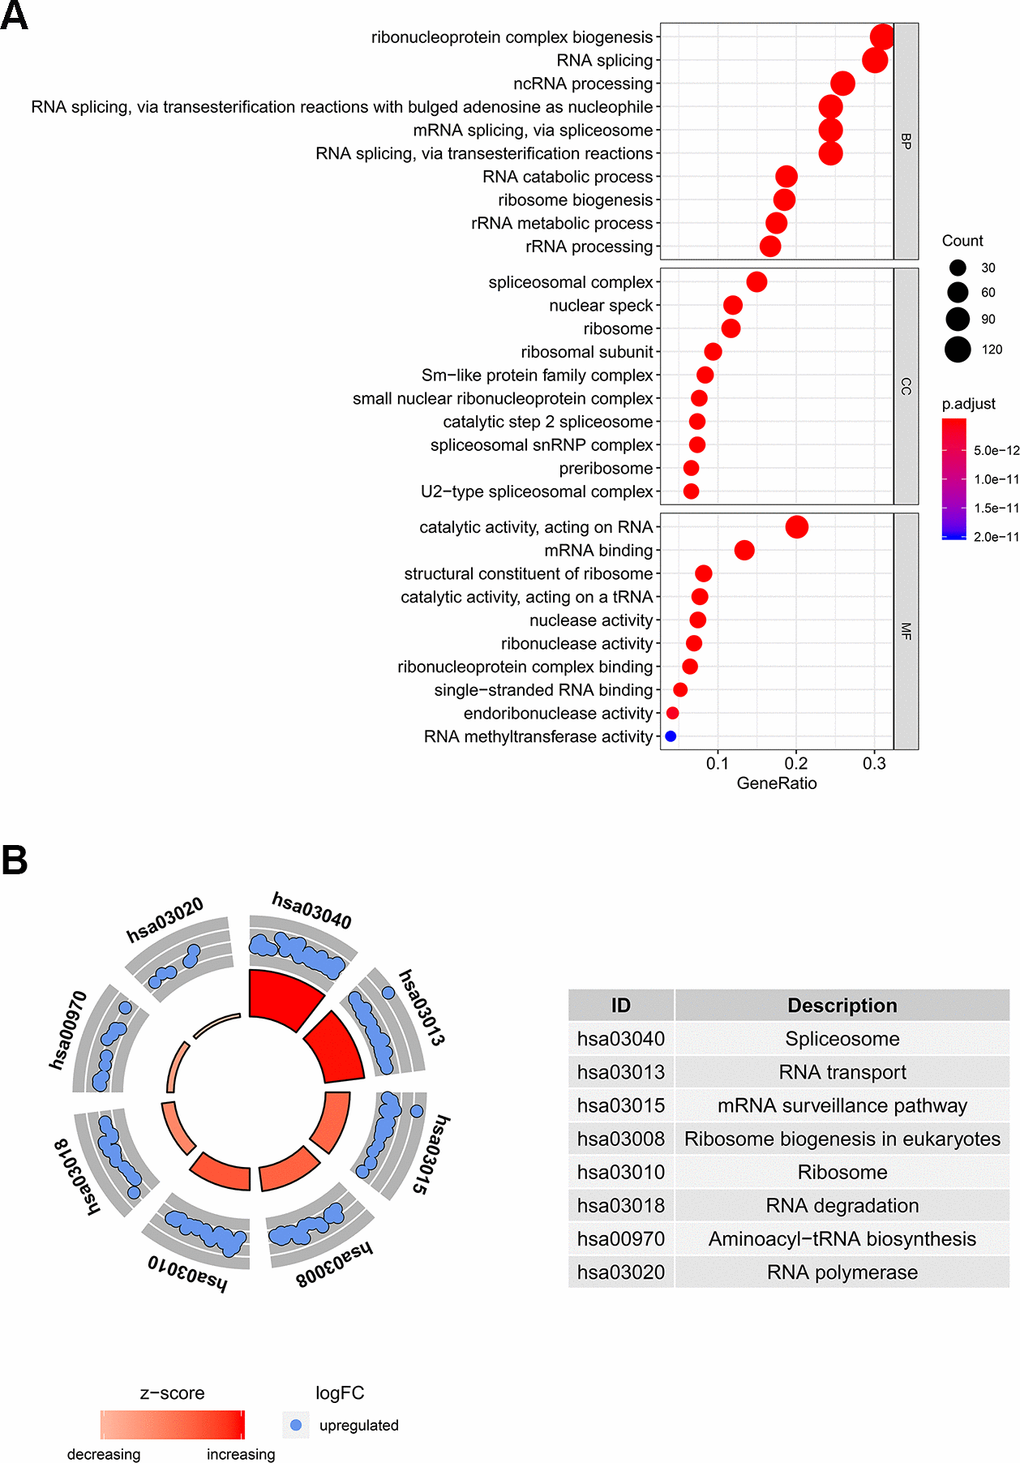
Figure 2.
GO and KEGG pathway analysis of differentially expressed RBPs.
(
A
) The top 10 significantly enriched BPs, CCs and MFs in GO analysis. (
B
) The top 8 significantly enriched pathways in KEGG pathway analysis.