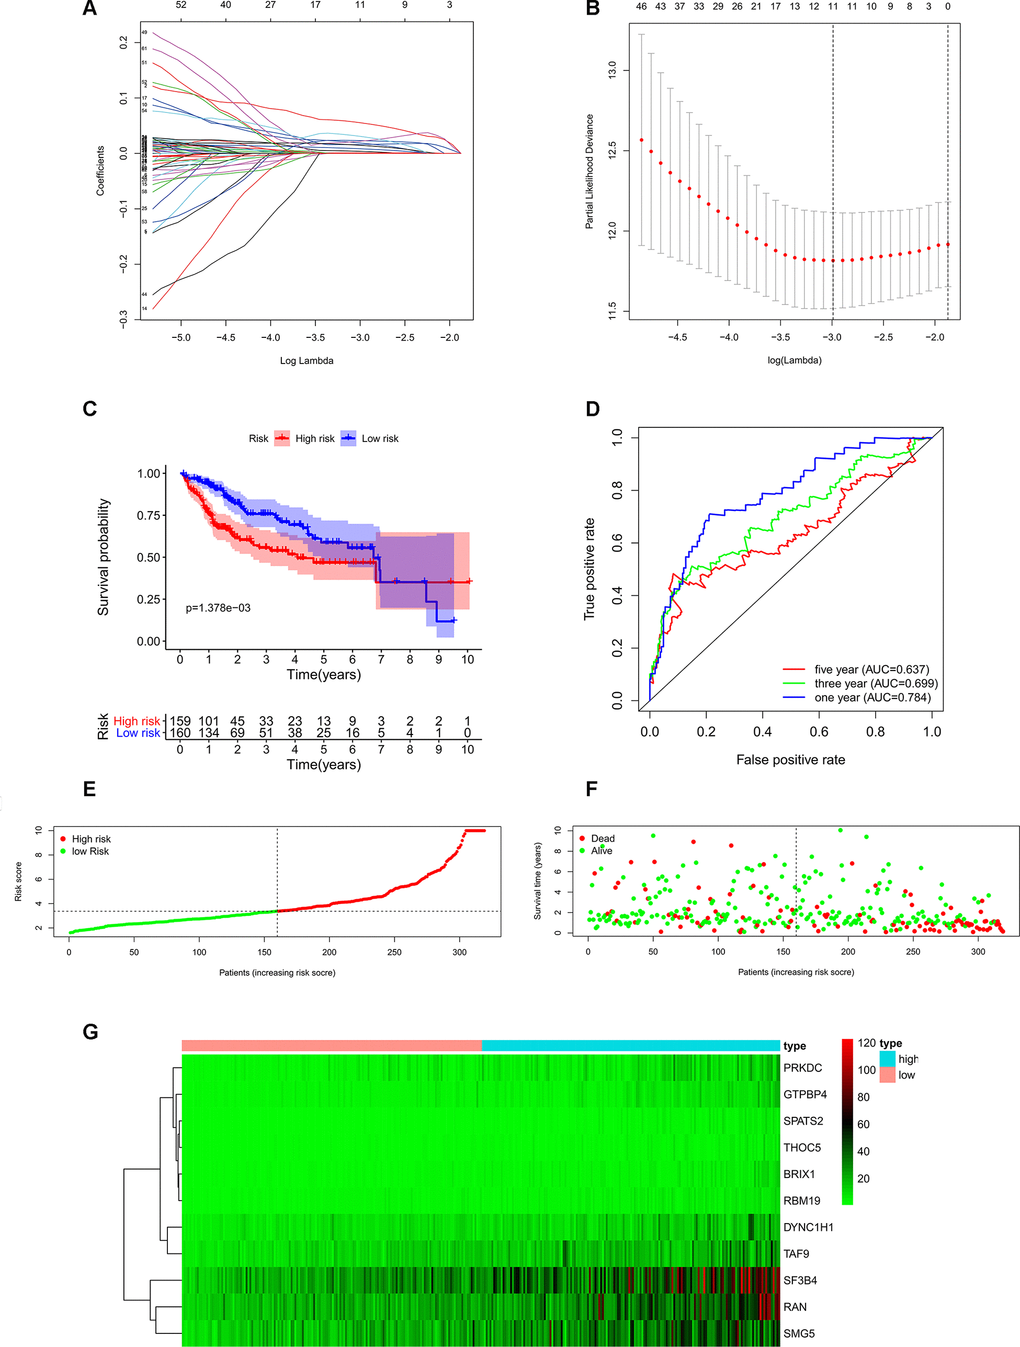
Figure 4.Construction of risk score model based on prognostic RBPs in the TCGA-LIHC cohort. (A) Each curve represents an RBP, and the best lambda was calculated to minimize mean cross-validated error. (B) Cross-validation for tuning parameter selection in the proportional hazards model. (C) Kaplan–Meier survival curve of TCGA-LIHC patients. (D) Time-dependent ROC curves for predicting OS based on risk scores. (E) TCGA-LIHC patients were divided into low-risk group and high-risk group by the median of risk score values. (F) Scatter plots show that different risk scores indicate different survival outcomes in the TCGA-LIHC patients. (G) The heatmap exhibited the 11 RBPs expression profiles in each TCGA-LIHC patient. Red was defined as high expression and blue indicated as low expression.