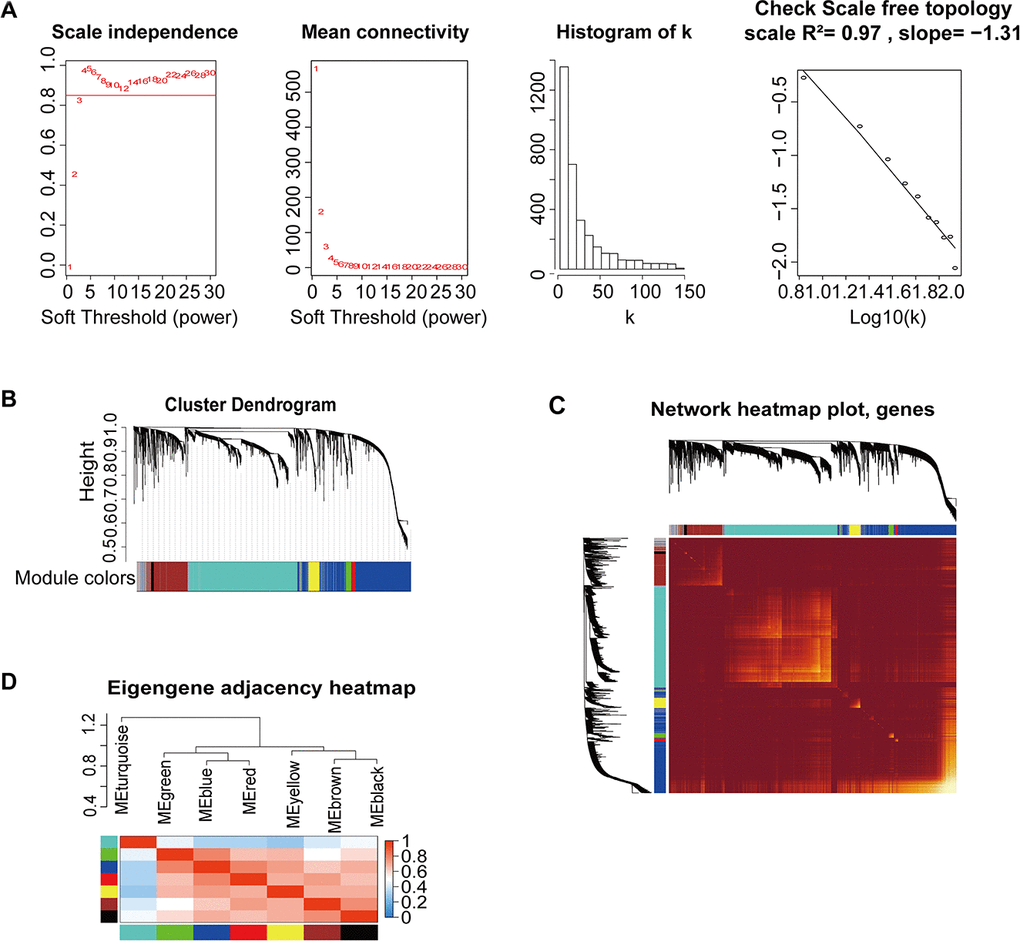
Figure 2.Construction of co-expression modules based on BRCA RNA-seq data from TCGA database by WGCNA. (A) Analysis of network topology for various soft-threshold powers. Check scale-free topology; the adjacency matrix was defined using soft-thresholds with β=4. (B) Clustering dendrograms of genes, with dissimilarity based on topological overlap, together with assigned module colors. (C) Heatmap depicting the topological overlap matrix (TOM) among genes based on co-expression modules. A redder background indicates a higher module correlation. (D) Visualization of the gene network using a heatmap plot.