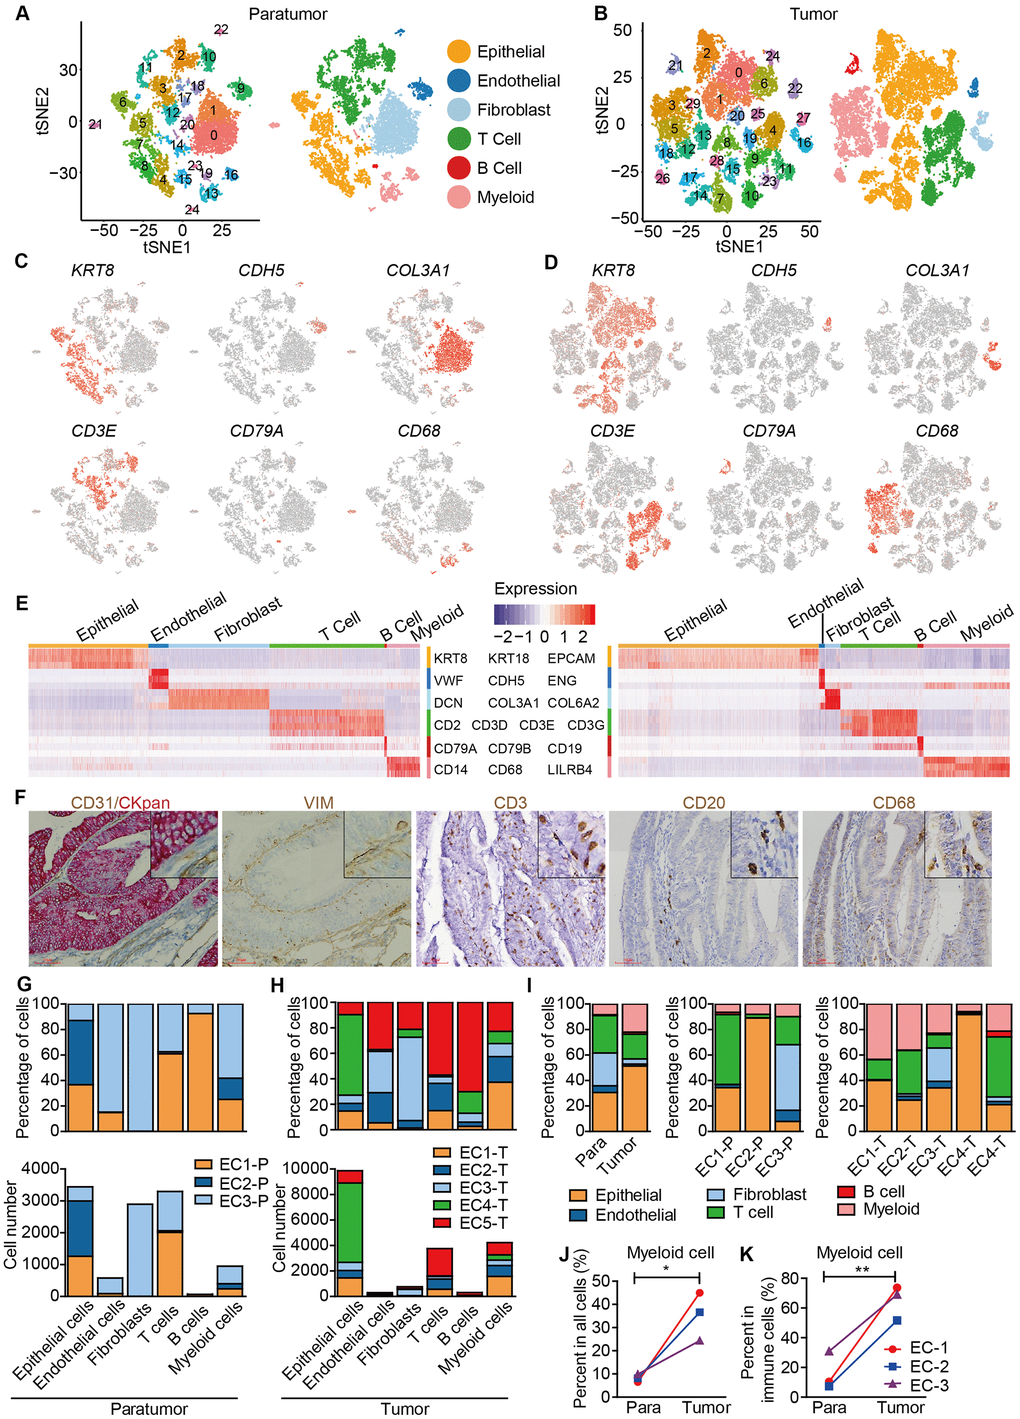
Figure 2.Unbiased characterization of multiple cell types from integrated tumor and paratumor samples. (A, B) t-SNE projection of the 11,275 cells from 3 integrated paratumor samples (A) and 19,505 cells from 5 integrated tumor samples (B), color-coded by their associated cluster (left) or the assigned cell type (right). (C, D) Expression of marker genes of each cell type defined in A and B. (E) Heatmap showing the expression levels of known markers of epithelial cells epithelial cells (KRT8, KRT18, EPCAM), endothelial cells (CDH5, VWF, ENG), fibroblasts (COL3A1, COL6A2, DCN), T cells (CD2, CD3D, CD3E, CD3G), B cells (CD79A, CD79B, CD19) and myeloid cells (CD14, CD68, LILRB4) in Paratumor (left panel) and Tumor (right panel). (F) Representative images of epithelial cells, endothelial cells, fibroblasts, T cells, B cells and myeloid cells of EC4, after IHC staining with CKpan, CD31, VIM, CD3, CD20 and CD68 antibodies, respectively. Scale bars, 80 mm. (G, H) For each cell type: the cell fractions and numbers originating from each of the 3 paratumor and 5 tumor samples are shown. (I) The fractions of the six cell types in paratumor and tumor samples (left), and in each patient (middle and right). (J, K) The percentages of myeloid cells of all cells (J) and immune cells (K) in paratumor and tumor samples. Data were analyzed using a students’ t-test, *P < 0.05, **P < 0.01.