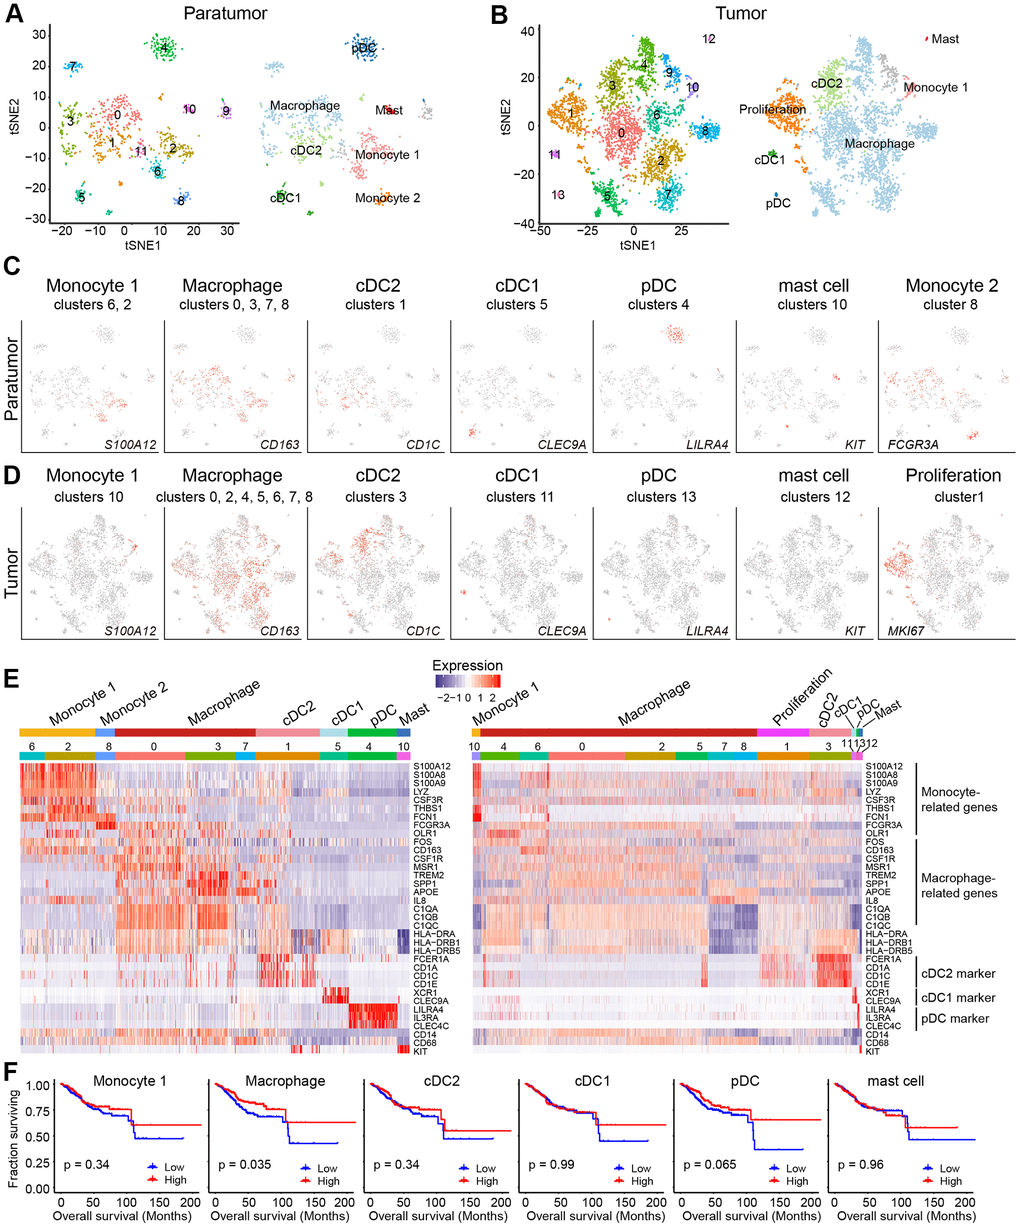
Figure 3.Myeloid cell clusters in paratumors and endometrial tumors. (A, B) t-SNE plot of 936 myeloid cells in Paratumor (A) and 4,152 myeloid cells in Tumor (B), color-coded by their associated cluster (left) or the assigned subtype (right). (C, D) t-SNE plot, color-coded for relative expression (lowest expression to highest expression, gray to red) of marker genes for the myeloid subtypes in Paratumor (C) and Tumor (D). (E) Heatmaps created using known gene expression profiles of myeloid cells in Paratumor (left panel) and Tumor (right panel). The identity of each cluster was assigned using known markers. (F) The overall survival curves based on TCGA-UCEC data (n = 549 patients), stratified for the average expression (binary: high versus low) of tumor myeloid cell marker genes.