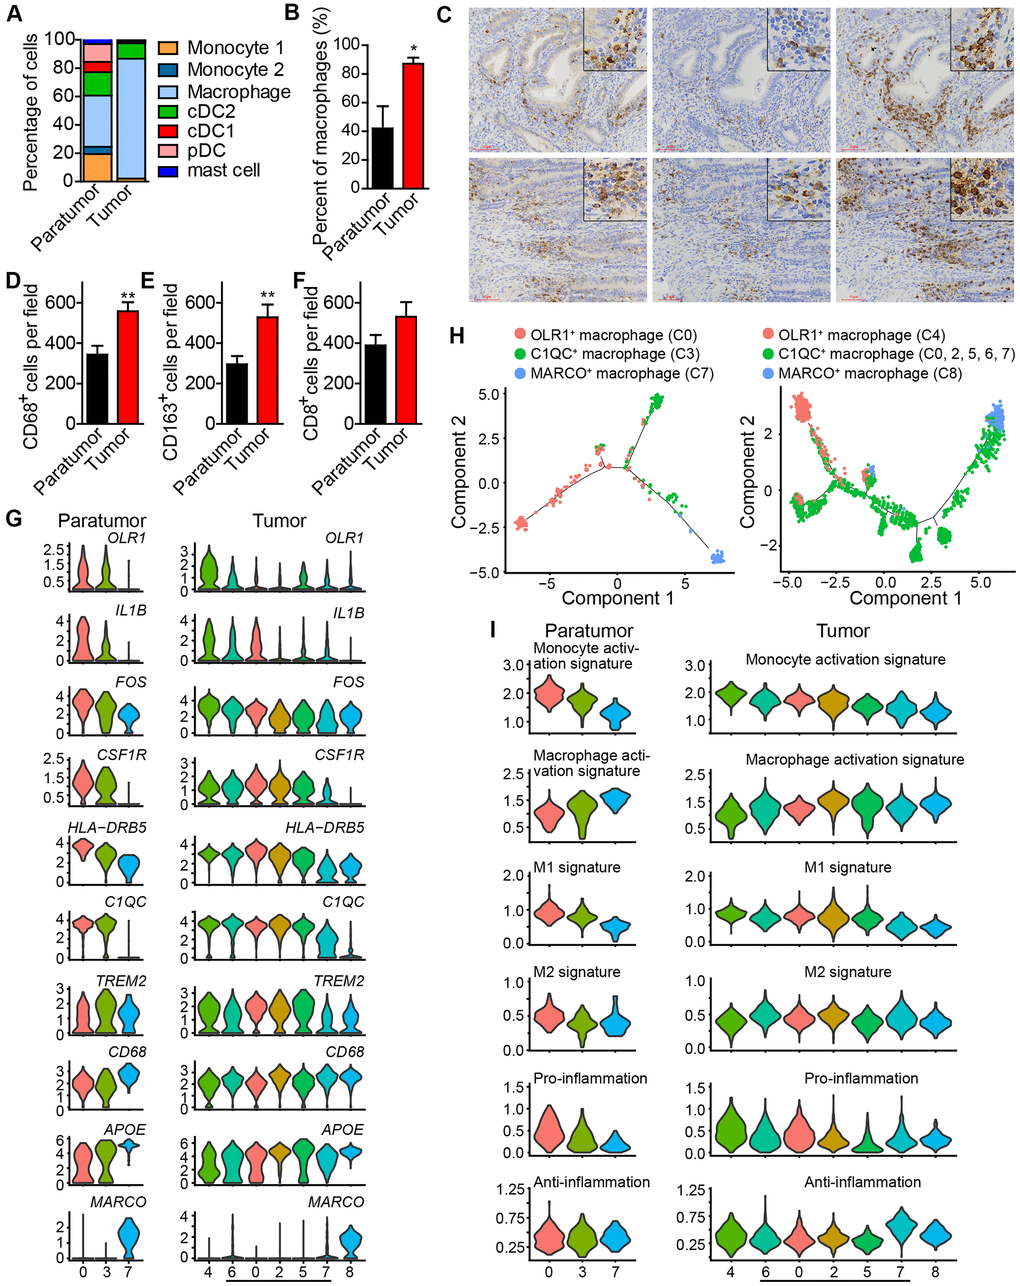
Figure 4.Enrichment of macrophages in endometrial tumors and distinct macrophage populations. (A) The fractions of myeloid subtypes in Paratumor and Tumor. (B) The percentage of macrophages in paratumor and tumor tissues. *P < 0.05, Student’s t test. (C) IHC staining images of CD68, CD163 and CD8 in paratumor and tumor slides isolated from endometrial carcinoma sections. Scale bars, 80 μm. (D–F) Quantification of the numbers of CD68+, CD163+ and CD8+ cells as presented in (C) Data are means ± SEM (30 paratumor sections and 40 tumor sections were analyzed). **P <0.01 versus paratumor group (Student’s t-test). (G) Violin plots displaying the expression profile of representative genes related to monocyte-macrophage lineage across the macrophage clusters in Paratumor (left panel) and Tumor (right panel). The y axis shows the normalized expression. (H) Pseudo-time analysis of 3 macrophage populations from Paratumor (left) and Tumor (right) inferred by Monocle2. Each point corresponds to a single cell, and each color represents a macrophage population as indicated. (I) Violin plots indicating relative expression levels of monocyte activation, macrophage activation, M1, M2, pro-inflammation and anti-inflammation gene signatures across the macrophage clusters in Paratumor (left panels) and Tumor (right panels).