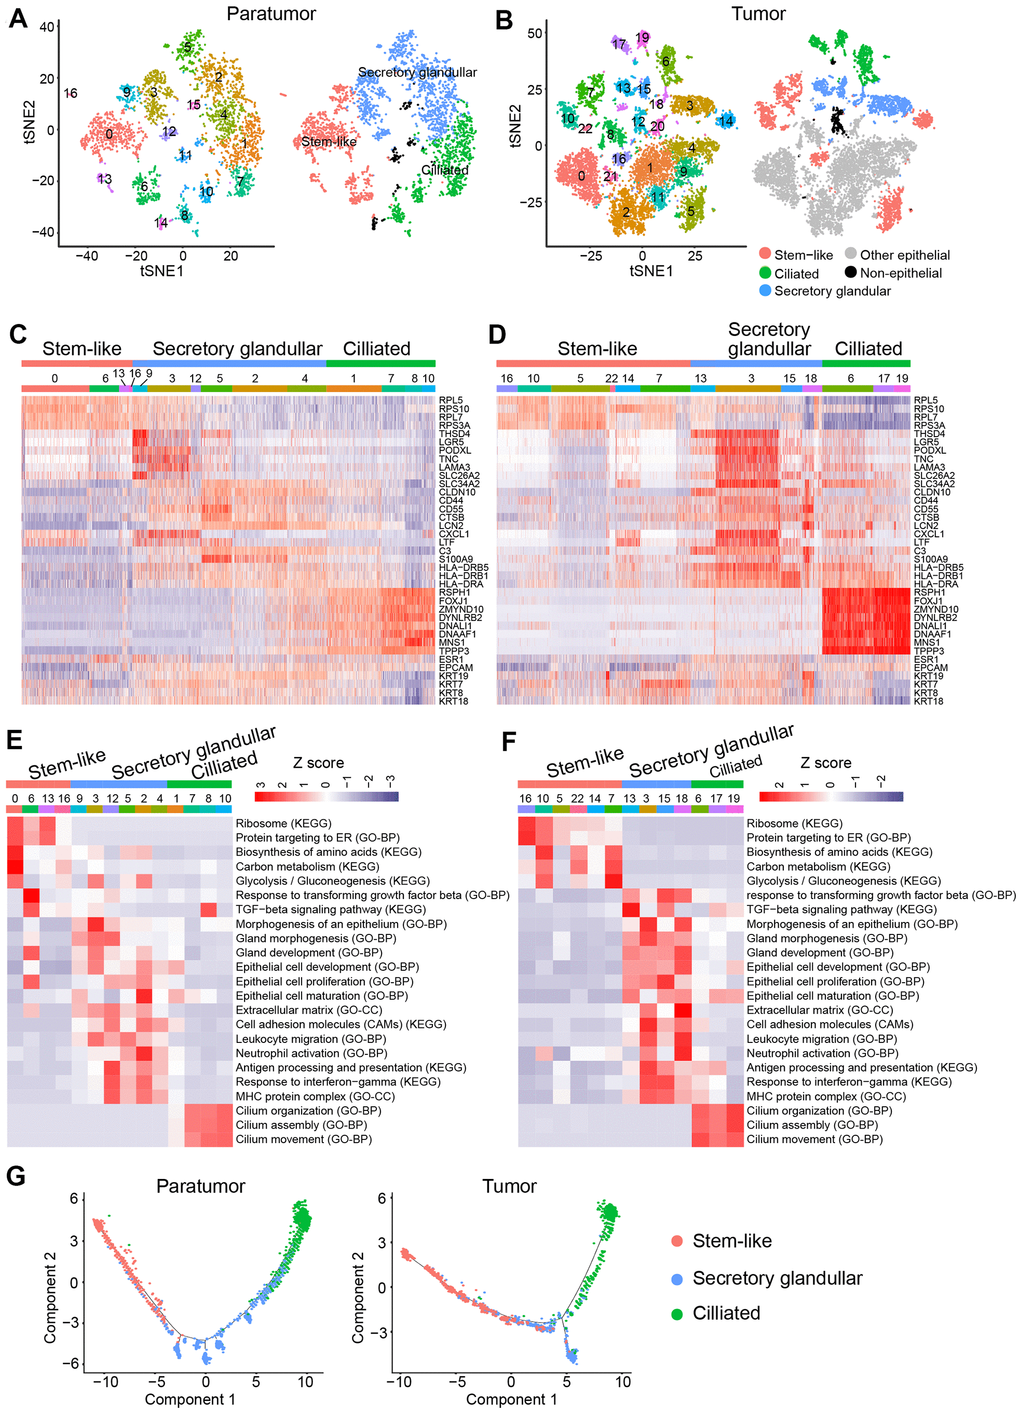
Figure 8.Endometrial epithelial cell clusters in paratumors and endometrial tumors. (A, B) t-SNE plot of 3,403 endometrial epithelial cells in Paratumor (A) and 9,789 endometrial epithelial cells in Tumor (B), color-coded by their associated cluster (left) or the assigned subtype (right). (C, D) Heatmap analysis using known gene expression profiles of endometrial epithelial cells from Paratumor (C) and Tumor (D). The identity of each cluster was assigned by known markers recently reported. (E, F) The enriched gene ontology terms for genes with specific expression in each endometrial epithelial cluster in Paratumor (E) and Tumor (F). Color key from blue to red indicates z-score of -Log10(P value). (G) Pseudo-time analysis of endometrial epithelial cells from Paratumor (left) and Tumor (right) inferred by Monocle2. Each point corresponds to a single cell, and each color represents an endometrial epithelial subtype as indicated.