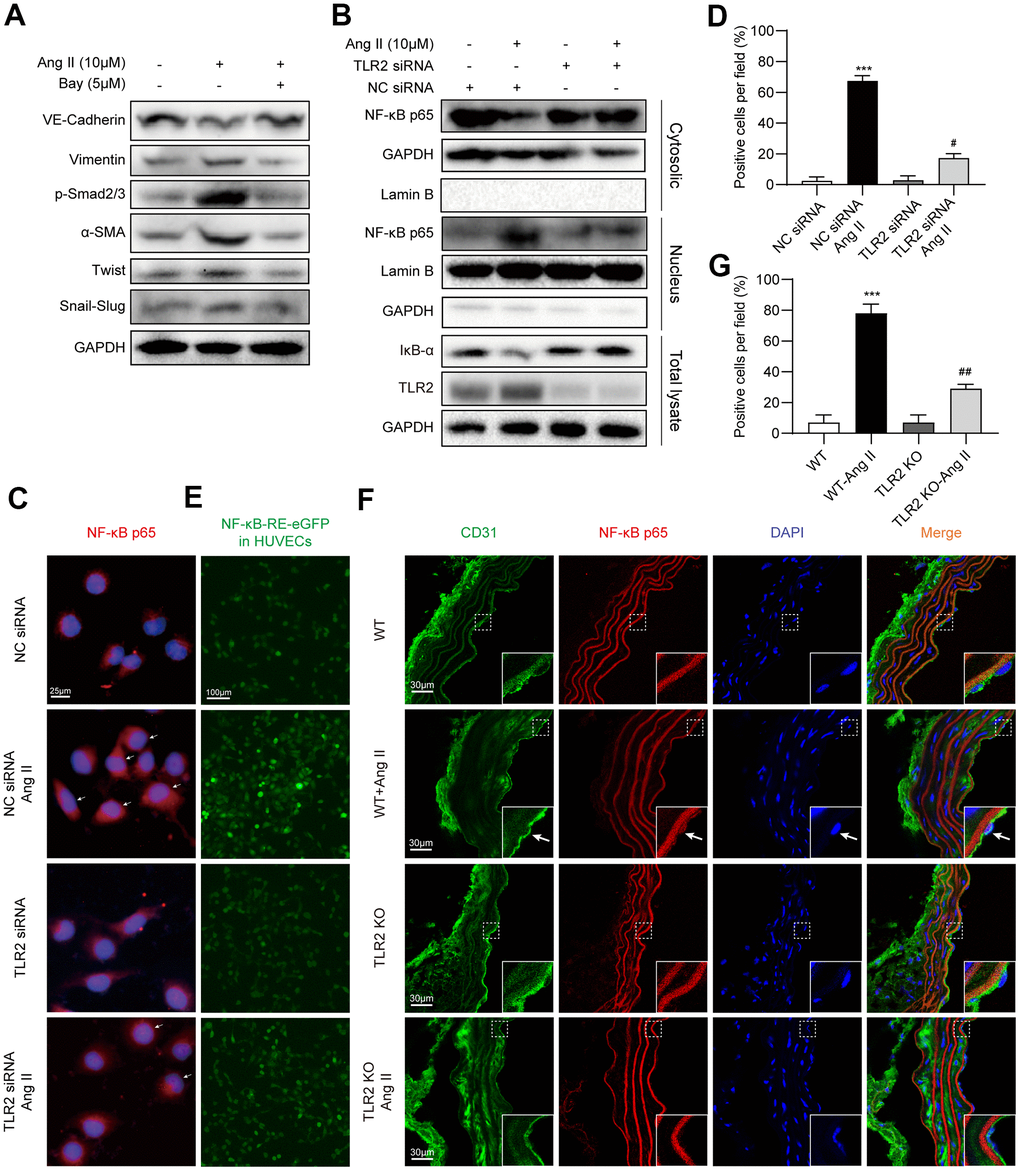
Figure 4.TLR2 regulates EndMT through NF-κB. (A) HUVECs were pretreated with NF-κB inhibitor Bay 11-7085 at 5 μM for 1 h. Cells were then exposed to 10 μM Ang II for 36 h. Levels of EndMT proteins were detected by immunoblotting. GAPDH was used as loading control. (B) HUVECs were transfected with TLR2 siRNA or negative control siRNA. Transfected cells were exposed to 10 μM Ang II for 2 h. Total proteins, and nuclear and cytoplasmic fractions were probed for NF-κB p65 subunit and inhibitor of κBα (IκB). GAPDH was used as loading control for total proteins and cytosolic fractions. Lamin B was used as loading control for nuclear fractions. (C) Cells treated as indicated in Panel B were stained for p65 subunit (red). Counterstaining with DAPI was performed [scale bar = 25 μm]. (D) Quantitative analysis of nuclear p65 staining in HUVECs. Representative staining images are shown in panel C. (E) HUVECs expressing NFκB-EGFP reporter were transfected with NC siRNA or TLR2 siRNA, and challenged with 10 μM Ang II for 2 h. Representative images of EGFP (green) fluorescence of each group are shown [scale bar = 100 μm]. (F) Immunofluorescence staining of aortic tissues for CD31 (green) and NF-κB p65 (red). Tissues were counterstained with DAPI [scale bar = 30 μm]. Inserts showing high-power images of tissues (arrows indicating endothelial cells). (G) Quantitative florescence intensity of p65 in tissues, expressed as percent positive cells. Representative fluorescence images are shown in panel F. [n = 3 in A-E; n = 7 per group in F and G; Data shown as Mean ± SEM; ***p<0.001 compared to negative control siRNA transfection (D) or wildtype mice (G); #p<0.05 compared to NC siRNA+Ang II (D) or WT-Ang II (G)].