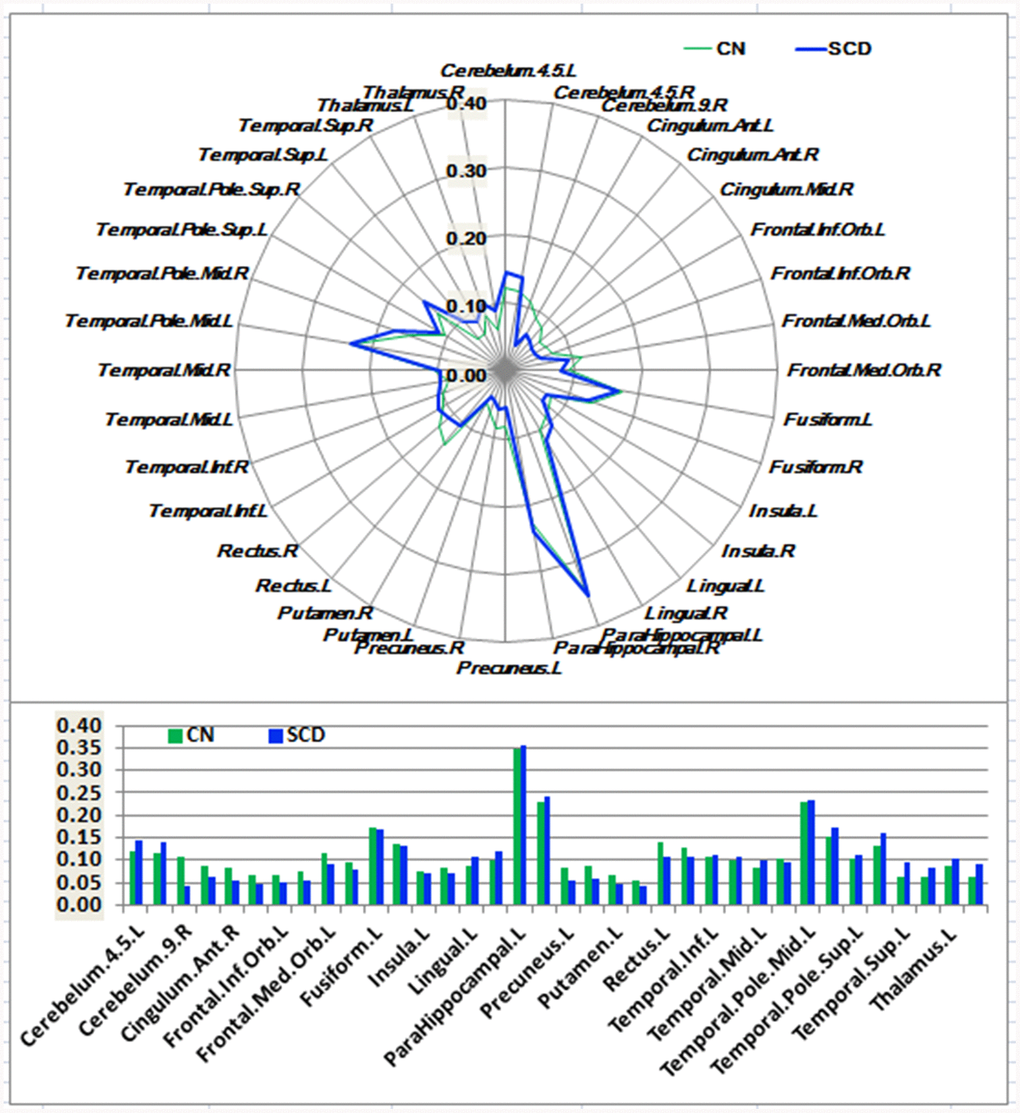
Figure 1.Schematic polar plot and bar chart depicting distinct functional connectivity patterns of HIPe seeds with target regions of interest (ROI) distributed across the whole brain among CN and SCD subjects. The concentric circles depict parameter estimates representing the connectivity strength. Note that the functional connectivity data are extracted only from the brain regions that most robustly correlated with each HIPe seed in SCD and CN, corresponding to Supplementary Figure 3. Automated anatomic labeling (AAL) atlas with 116 regions was additionally used to define the ROIs in the polar plots. Abbreviations: CN, healthy controls; SCD, subjective cognitive decline; HIPe, hippocampal emotional region; ROI, region of interest.