


Introduction
Subjective cognitive decline (SCD) is characterized by a self-report of persistent memory decline whilst cognitive performance remains within the normal range [1]. It is widely accepted that SCD, which gives rise to mild cognitive impairment (MCI), is potentially the initial preclinical stage of Alzheimer’s disease (AD) [2–6]. The hippocampus, a hallmark of AD [7–9], is a prominent region which is initially involved in memory decline. Over the years, a growing body of research has consistently reported hippocampal atrophy in SCD subjects [3, 10, 11]. However, little is known about the hippocampal network connectivity of SCD subjects in the networks of hippocampal subregions. Consequently, a lack of understanding with regard to the pathophysiology of SCD hampers the development of new interventions and could prevent the clinical progression of SCD to MCI/AD.
In the past few years, neuroimaging evidence has consistently indicated the presence of afunctional heterogeneity in hippocampus subregions (HIPsub) [12–14]. A recent neuroimaging meta-analytic study divulged that the left hippocampus comprised the anterior emotional region (HIPe), middle cognitive region (HIPc), and posterior perceptual region (HIPp) based on its neurofunctional topography [12]. In addition, several studies have revealed that HIPsub topography is pathologically involved in preclinical AD [11, 14, 15]. It was also recently reported that SCD exhibited structural and functional alterations in the hippocampus [3, 10, 11, 15, 16]. Converging evidence suggested that SCD might present distinct patterns of alterations in HIPsub network connectivity. Consequently, there is mounting interest in uncovering approaches for the improvement of dysfunctional HIPsub network connectivity.
Neuromodulation techniques, including repetitive transcranial magnetic stimulation (rTMS), could provide an opportunity to modulate intrinsic connectivity networks. Over recent years, rTMS was broadly applied when investigating the changes across cortical networks [17–19]. rTMS allowed the local stimulation of an accessible network node to transmit across synapses to remote interconnected nodes with high spatial specificity [18, 20, 21]. Hence, this approach could establish a causal link between the applied stimulation and the observed changes in HIPsub network connectivity.
A previous neuromodulation study established that rTMS, which targeted the parietal cortex, improved hippocampal connectivity networks, and simultaneously ameliorated associative memory performance in healthy individuals [22]. When directed at the posterior cortical-hippocampal network, rTMS improved the precision of memory recollection [23]. In a recent MCI neuromodulation study, rTMS promoted the improvement of episodic memory by targeting the precuneus [24]. The precuneus, generally known as a remote interconnected node of hippocampal intrinsic connectivity networks [22, 25], is a critical vulnerability area for the deficit in episodic memory observed in early AD [26, 27]. Based on the above-mentioned findings, it is reasonable to speculate that whilst rTMS is directed at the precuneus in the HIPsub network, it could causally modulate the altered HIPsub network connectivity in SCD subjects.
In the present study, we first proposed a strategy to empirically investigate a pathological circuit in HIPsub related to SCD using a pattern classification approach (SVM: support vector machine). After identifying the potentially dysfunctional circuit, we aimed to activate it with rTMS in order to assess the causal links in a separate cohort. We hypothesized that SCD subjects would display distinct alterations in the patterns of HIPsub network connectivity and that these aberrations in the HIPsub circuit related to episodic memory processing could be improved by rTMS directed upon the precuneus in the HIPsub network of SCD subjects
Results
Demographic, clinical and cognitive function characteristics
Compared with CN, SCD subjects had no significant differences in age, gender, education, general cognitive function (i.e., MMSE, MoCA, MDRS scores), and multimodal cognitive function (i.e., episodic memory, information processing speed, executive function, visuospatial function) (all p > 0.05, 10000 bootstraps) in the presence of higher HAMD and SCD-Q (all p < 0.05, 10000 bootstraps). Table 1 shows the characteristics of the study population.
Table 1. Demographic characteristics, clinical measures, and head rotation parameters of SCD subjects and CN.
| Items | CN | SCD | |||||||||||||||||||||||||||||||||||||||||||||||||||||||||||||||||||||||||||||||||||||||||||||||||
| n=55 | n=38 | ||||||||||||||||||||||||||||||||||||||||||||||||||||||||||||||||||||||||||||||||||||||||||||||||||
| Age (years) | 62.91(5.94) | 65.84(7.73) | |||||||||||||||||||||||||||||||||||||||||||||||||||||||||||||||||||||||||||||||||||||||||||||||||
| Gender (male/female) | 23/32 | 8/30 | |||||||||||||||||||||||||||||||||||||||||||||||||||||||||||||||||||||||||||||||||||||||||||||||||
| Education level (years) | 12.51(2.51) | 12.22(2.72) | |||||||||||||||||||||||||||||||||||||||||||||||||||||||||||||||||||||||||||||||||||||||||||||||||
| MMSE | 28.58(1.43) | 28.32(2.63) | |||||||||||||||||||||||||||||||||||||||||||||||||||||||||||||||||||||||||||||||||||||||||||||||||
| MoCA | 25.05(2.42) | 24.92(1.79) | |||||||||||||||||||||||||||||||||||||||||||||||||||||||||||||||||||||||||||||||||||||||||||||||||
| MDRS | 141.46(2.33) | 140.37(3.05) | |||||||||||||||||||||||||||||||||||||||||||||||||||||||||||||||||||||||||||||||||||||||||||||||||
| HAMD | 1.82(2.26) | 3.92(3.17) a | |||||||||||||||||||||||||||||||||||||||||||||||||||||||||||||||||||||||||||||||||||||||||||||||||
| SCD-Q | 3.55(1.50) | 6.51(0.90) a | |||||||||||||||||||||||||||||||||||||||||||||||||||||||||||||||||||||||||||||||||||||||||||||||||
| ITV | 1130.24(114.65) | 1083.55(109.21) a | |||||||||||||||||||||||||||||||||||||||||||||||||||||||||||||||||||||||||||||||||||||||||||||||||
| Episodic memory tests | |||||||||||||||||||||||||||||||||||||||||||||||||||||||||||||||||||||||||||||||||||||||||||||||||||
| AVLT-IR | range | 10~31 | 11~28 | ||||||||||||||||||||||||||||||||||||||||||||||||||||||||||||||||||||||||||||||||||||||||||||||||
| raw score | 19.15(4.36) | 18.66(4.22) | |||||||||||||||||||||||||||||||||||||||||||||||||||||||||||||||||||||||||||||||||||||||||||||||||
| Z score | 0.35(0.94) | 0.25(0.91) | |||||||||||||||||||||||||||||||||||||||||||||||||||||||||||||||||||||||||||||||||||||||||||||||||
| AVLT-5min-DR | range | 0~11 | 3~10 | ||||||||||||||||||||||||||||||||||||||||||||||||||||||||||||||||||||||||||||||||||||||||||||||||
| raw score | 6.35(2.20) | 6.26(1.90) | |||||||||||||||||||||||||||||||||||||||||||||||||||||||||||||||||||||||||||||||||||||||||||||||||
| Z score | 0.34(0.93) | 0.31(0.80) | |||||||||||||||||||||||||||||||||||||||||||||||||||||||||||||||||||||||||||||||||||||||||||||||||
| AVLT-20min-DR | range | 2~10 | 3~11 | ||||||||||||||||||||||||||||||||||||||||||||||||||||||||||||||||||||||||||||||||||||||||||||||||
| raw score | 6.30(1.94) | 6.32(2.12) | |||||||||||||||||||||||||||||||||||||||||||||||||||||||||||||||||||||||||||||||||||||||||||||||||
| Z score | 0.40(0.73) | 0.41(0.80) | |||||||||||||||||||||||||||||||||||||||||||||||||||||||||||||||||||||||||||||||||||||||||||||||||
| AVLT-total | range | 17~51 | 19~48 | ||||||||||||||||||||||||||||||||||||||||||||||||||||||||||||||||||||||||||||||||||||||||||||||||
| raw score | 31.79(7.61) | 31.24(7.39) | |||||||||||||||||||||||||||||||||||||||||||||||||||||||||||||||||||||||||||||||||||||||||||||||||
| Composite Z scores of each cognitive domain | |||||||||||||||||||||||||||||||||||||||||||||||||||||||||||||||||||||||||||||||||||||||||||||||||||
| Episodic memory | 0.27(0.53) | 0.34(0.59) | |||||||||||||||||||||||||||||||||||||||||||||||||||||||||||||||||||||||||||||||||||||||||||||||||
| Information processing speed | 0.27(0.67) | 0.18(0.71) | |||||||||||||||||||||||||||||||||||||||||||||||||||||||||||||||||||||||||||||||||||||||||||||||||
| Executive function | 0.27(0.48) | 0.30(0.57) | |||||||||||||||||||||||||||||||||||||||||||||||||||||||||||||||||||||||||||||||||||||||||||||||||
| Visuospatial function | 0.17(0.66) | 0.26(0.50) | |||||||||||||||||||||||||||||||||||||||||||||||||||||||||||||||||||||||||||||||||||||||||||||||||
| Head rotation parameters | |||||||||||||||||||||||||||||||||||||||||||||||||||||||||||||||||||||||||||||||||||||||||||||||||||
| FD_VanDijk | 0.05(0.03) | 0.04(0.03) | |||||||||||||||||||||||||||||||||||||||||||||||||||||||||||||||||||||||||||||||||||||||||||||||||
| FD_Power | 0.18(0.08) | 0.16(0.09) | |||||||||||||||||||||||||||||||||||||||||||||||||||||||||||||||||||||||||||||||||||||||||||||||||
| FD_Jenkinson | 0.09(0.04) | 0.09(0.05) | |||||||||||||||||||||||||||||||||||||||||||||||||||||||||||||||||||||||||||||||||||||||||||||||||
| Data are presented as the mean (standard deviation, SD). Abbreviations: CN, healthy controls; SCD, subjective cognitive decline; MMSE, Mini Mental State Examination; MoCA, Montreal Cognitive Assessment; MDRS, Mattis Dementia Rating Scale; HAMD, Hamilton Depression Scale; SCD-Q, Subjective Cognitive Decline-Questionnaire; ITV, intracranial volume;AVLT-IR, Auditory Verbal Learning Test – immediate recall; AVLT-5min-DR, Auditory Verbal Learning Test – 5-minute delayed recall; AVLT-20min-DR, Auditory Verbal Learning Test – 20-minute delayed recall; FD, framewise displacement. a Significant differences were found between CN and SCD subjects. MMSE, MoCA, and MDRS are displayed as raw scores. This study used the composite Z scores to indicate the level of each cognitive domain. Note: this study used a re-sampling method of stationary bootstrap (10,000 bootstrap samplings) to improve the statistical power. | |||||||||||||||||||||||||||||||||||||||||||||||||||||||||||||||||||||||||||||||||||||||||||||||||||
Network discovery of altered HIPsub related to SCD
As shown in Figures 1–3 and Supplementary Figure 3, SCD subjects displayed distinct patterns of alterations in the HIPsub network connectivity (i.e. HIPe, HIPc, and HIPp networks) compared to CN. HIPesub region most robustly correlated with bilateral parahippocampal gyrus, left middle temporal pole, and left fusiform gyrus. HIPc subregion was more strongly correlated with bilateral parahippocampal gyrus, left lingual gyrus, left fusiform gyrus, and left thalamus. HIPp subregion most robustly correlated with bilateral parahippocampal gyrus, left lingual gyrus, and left middle cerebellum.
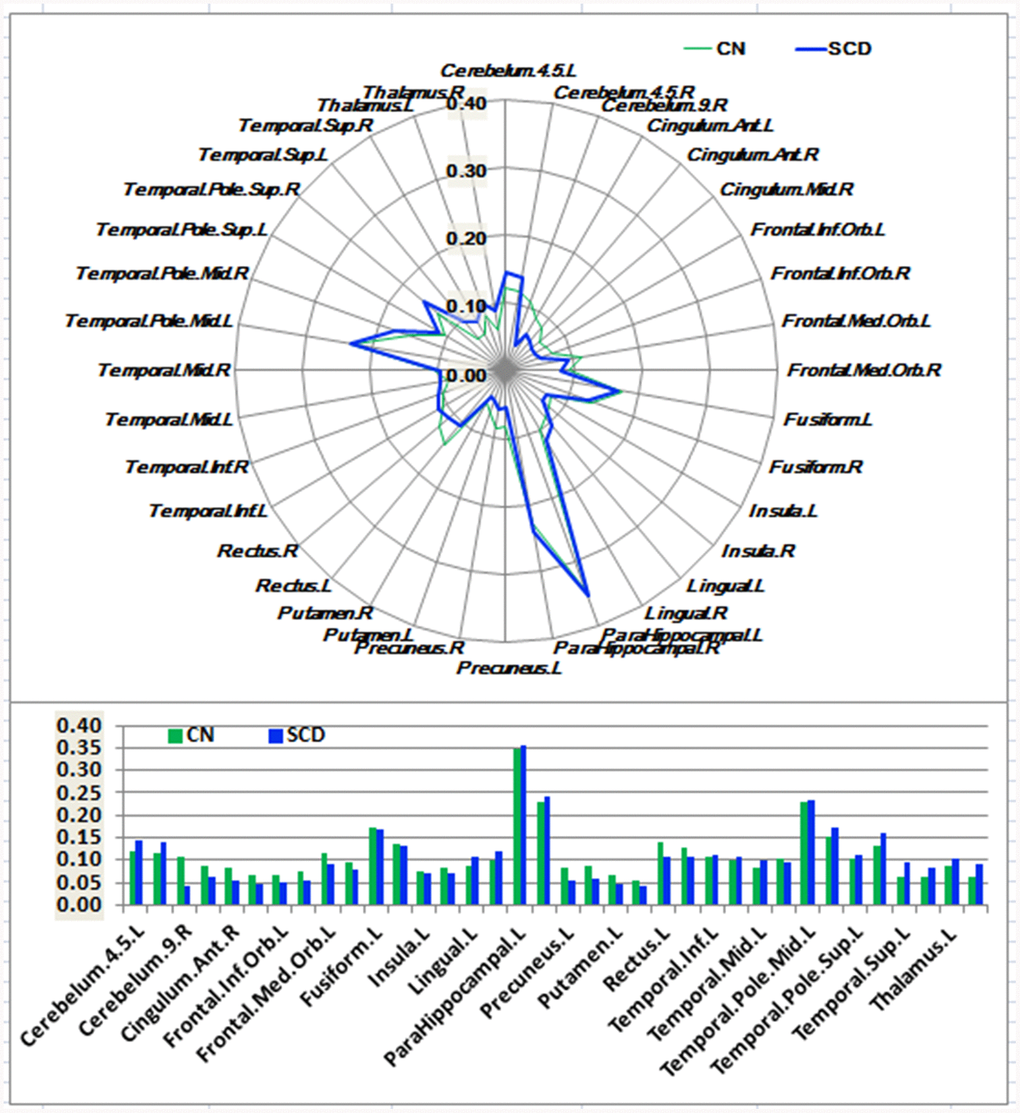
Figure 1. Schematic polar plot and bar chart depicting distinct functional connectivity patterns of HIPe seeds with target regions of interest (ROI) distributed across the whole brain among CN and SCD subjects. The concentric circles depict parameter estimates representing the connectivity strength. Note that the functional connectivity data are extracted only from the brain regions that most robustly correlated with each HIPe seed in SCD and CN, corresponding to Supplementary Figure 3. Automated anatomic labeling (AAL) atlas with 116 regions was additionally used to define the ROIs in the polar plots. Abbreviations: CN, healthy controls; SCD, subjective cognitive decline; HIPe, hippocampal emotional region; ROI, region of interest.
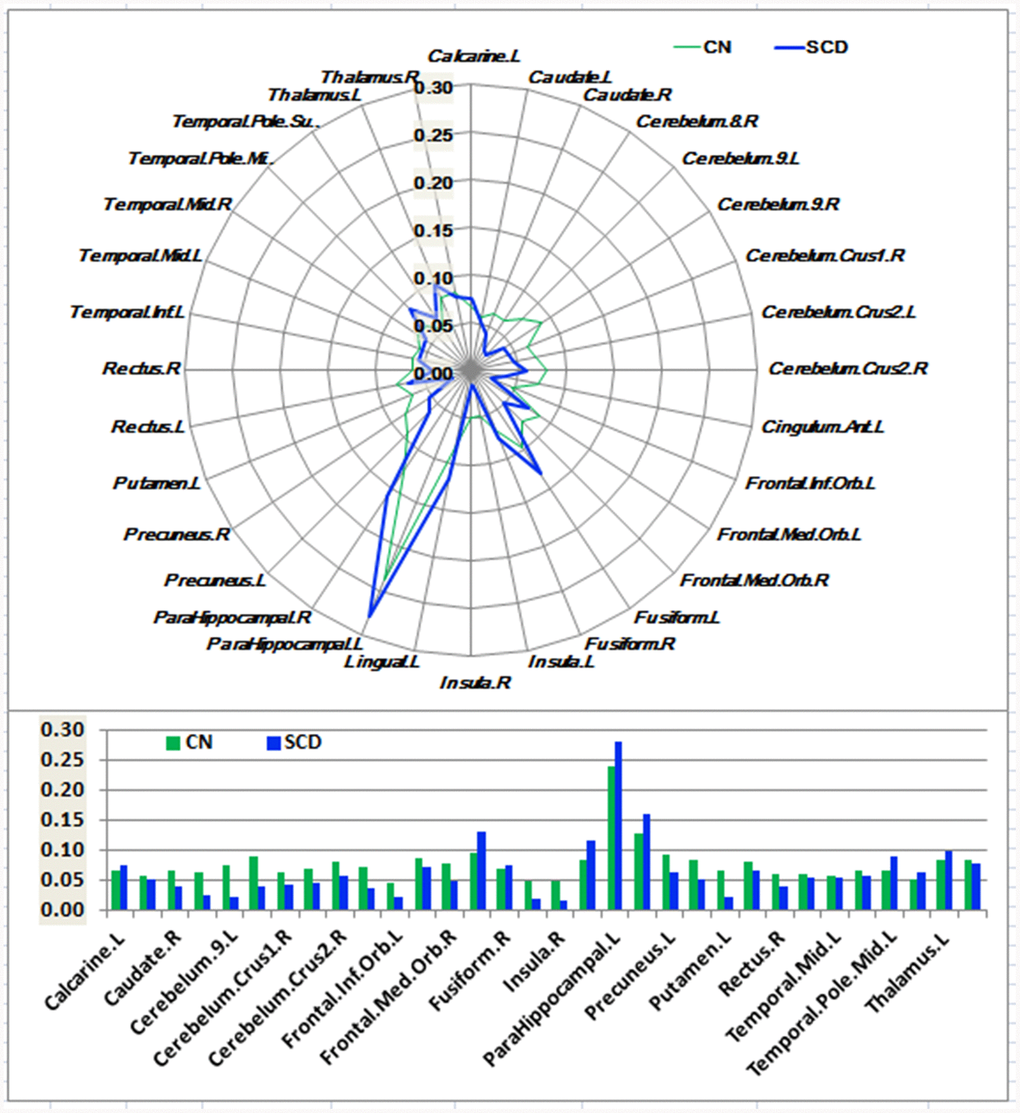
Figure 2. Schematic polar plot and bar chart depicting distinct functional connectivity patterns of HIPc seeds with target ROIs distributed across the whole brain among CN and SCD subjects. The concentric circles depict parameter estimates representing the connectivity strength. Note that the functional connectivity data are extracted only from the brain regions which most robustly correlated with each HIPc seed in SCD and CN, corresponding to Supplementary Figure 3. AAL atlas with 116 regions was also used to define the ROIs in the polar plots. Abbreviations: CN, healthy controls; SCD, subjective cognitive decline; HIPc, hippocampal cognitive region; ROI, region of interest.
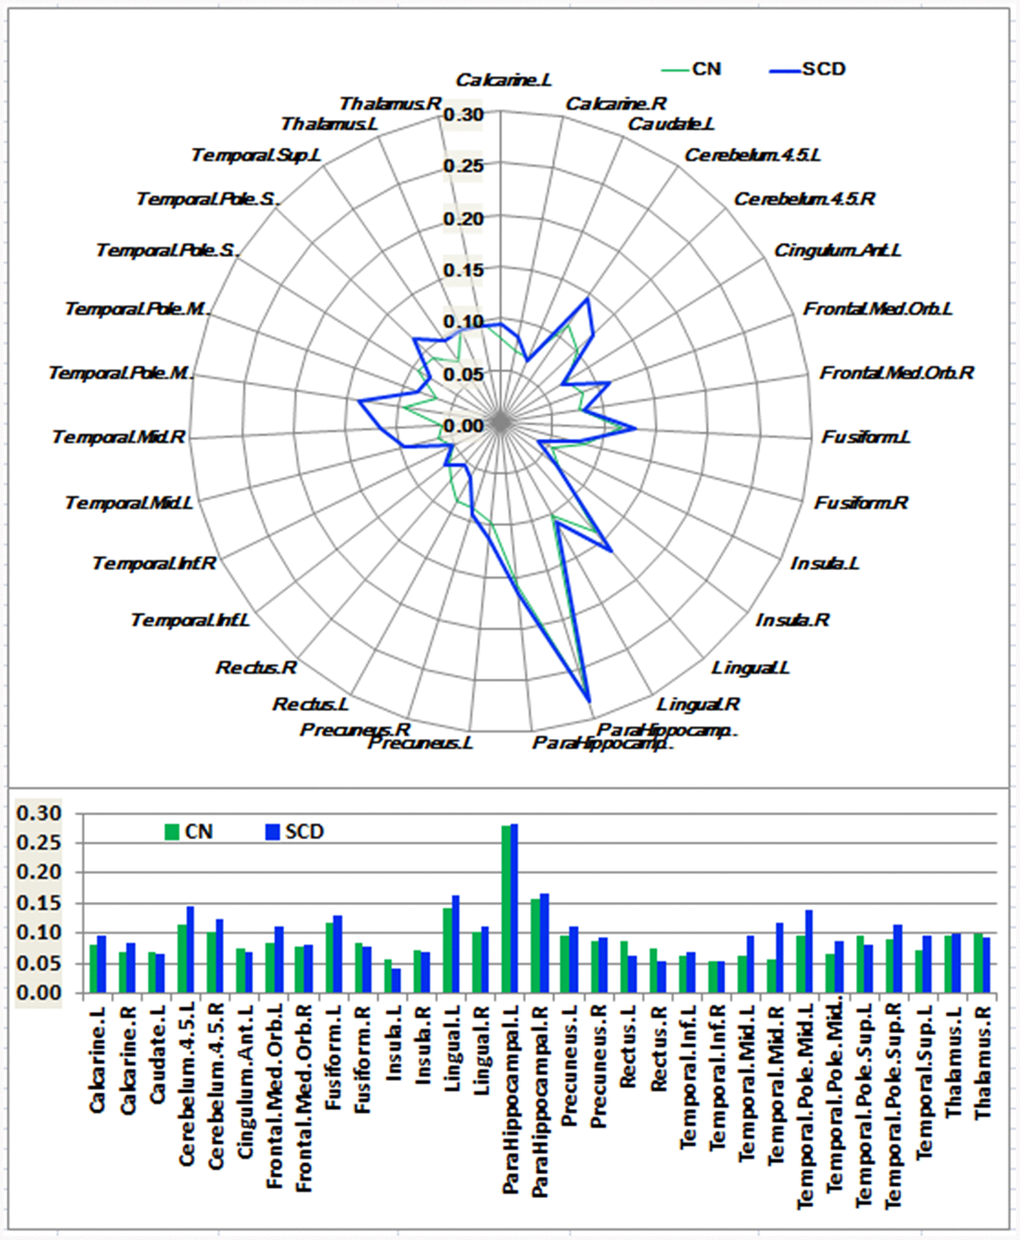
Figure 3. Schematic polar plot and bar chart depicting distinct functional connectivity patterns of HIPp seeds with target ROIs distributed across the whole brain among CN and SCD subjects. The concentric circles depict parameter estimates representing the connectivity strength. Note that the functional connectivity data are extracted only from the brain regions that most robustly correlated with each HIPp seed in SCD and CN corresponding to Supplementary Figure 3. AAL atlas with 116 regions was also used to define the ROIs in the polar plots. Abbreviations: CN, healthy controls; SCD, subjective cognitive decline; HIPp, hippocampal perceptual region; ROI, region of interest.
In the HIPe network, SCD subjects exhibited reduced FC in the right cerebellum posterior lobe, and increased FC in the left fusiform gyrus, left insula, and left parahippocampal gyrus in contrast to CN (PTFCE-FDR < 0.05, cluster size > 405 mm3) (Figure 4A and Supplementary Table 3). In the HIPc network, SCD had lower FC in the right inferior frontal gyrus (orbital part), and higher FC in the left parahippocampal gyrus when compared to CN (PTFCE-FDR < 0.05, cluster size > 405 mm3) (Figure 4B and Supplementary Table 3). In the HIPp network, SCD had decreased FC in the left medial frontal gyrus, and increased FC in the left insula, bilateral middle temporal gyrus, and left precuneus (PTFCE-FDR<0.05, cluster size > 405 mm3) (Figure 4C and Supplementary Table 3). All results were controlled for age, sex, education, ITV, and FD.
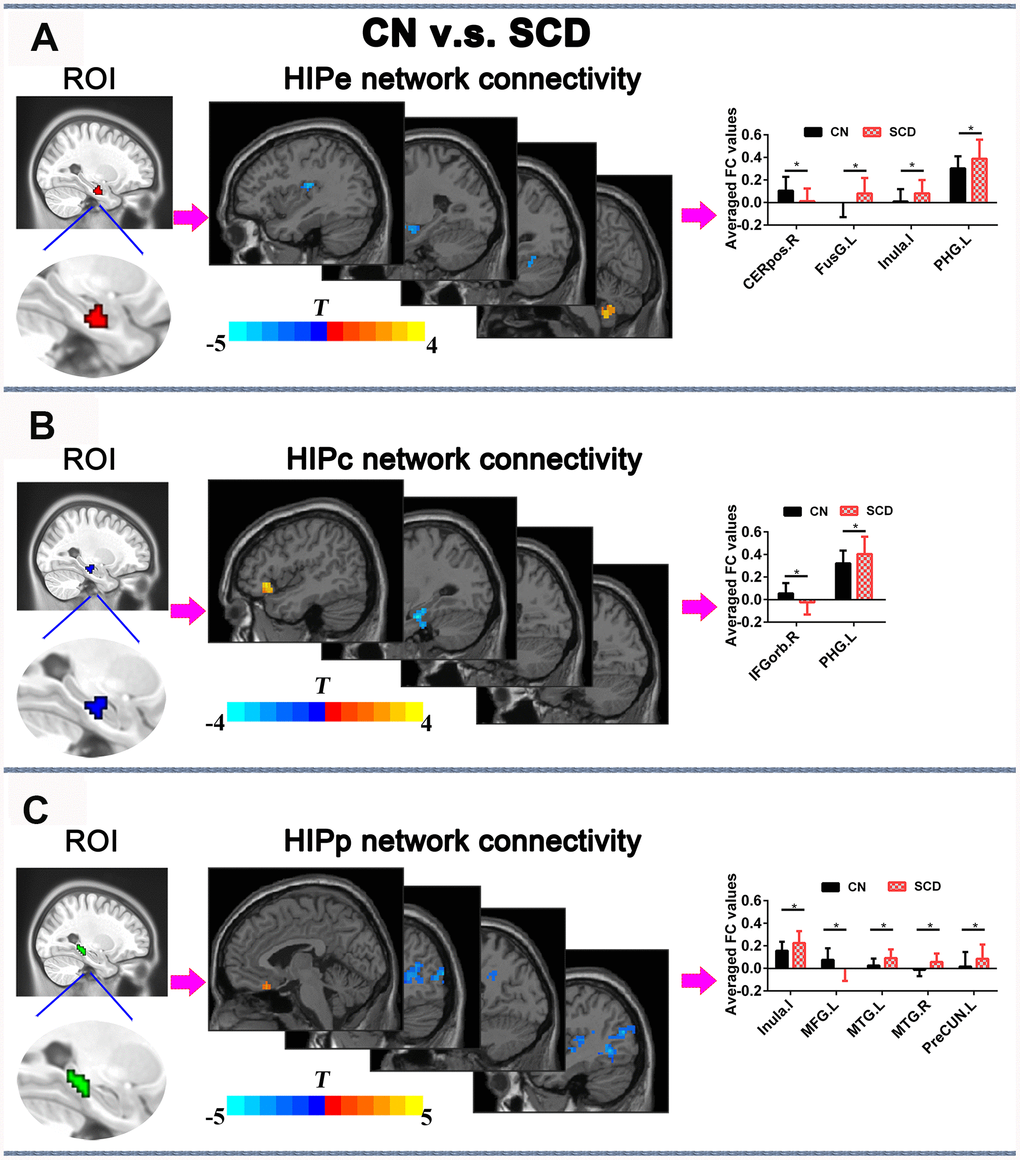
Figure 4. Differences in HIPsub functional connectivity between SCD subjects and CN before rTMS treatment after controlling for age, sex, education, ITV, and FD (p < 0.05, TFCE-FDR correction, cluster size > 405 mm3. (A) HIPe-subregion and different brain regions of the HIPe functional connectivity between CN and SCD subjects. The bar chart shows the quantitative comparison of functional connectivity in these regions. (B) HIPc-subregion and different brain regions of the HIPc functional connectivity between CN and SCD subjects. The bar chart depicts the quantitative comparison of functional connectivity in these regions. (C) HIPp-subregion and different brain regions of the HIPp functional connectivity between CN and SCD subjects. The bar chart indicates the quantitative comparison of functional connectivity in these regions. * PTFCE-FDR<0.05. Abbreviations: CN, healthy controls; SCD, subjective cognitive decline; HIPe, hippocampal emotional region; HIPc, hippocampal cognitive region; HIPp, hippocampal perceptual region; TFCE, threshold-free cluster enhancement; FDR, false discovery rate; ITV, Intracranial volume; FD, framewise displacement; CEREpos.R, right cerebellum posterior lobe; FusG.L, left fusiform gyrus; PHG.L, l gyrus; IFGorb.R, right inferior frontal gyrus, orbital part; MTG.R, right middle temporal gyrus; MTG.L, left middle temporal gyrus; MFG.L, left medial frontal gyrus; PreCUN.L, left precuneus.
Classification of SCD patients based on the altered HIPsub GM volumes and functional connectivities
The SVM classification had an accuracy of 86.0%. The SVM classifier’s receiver operating characteristic (ROC) curve demonstrated a high power in the discrimination of SCD patients from CN on an individual basis, with an AUC of 92.9%, 83.8% sensitivity, and 89.1% specificity as depicted in Figure 5.
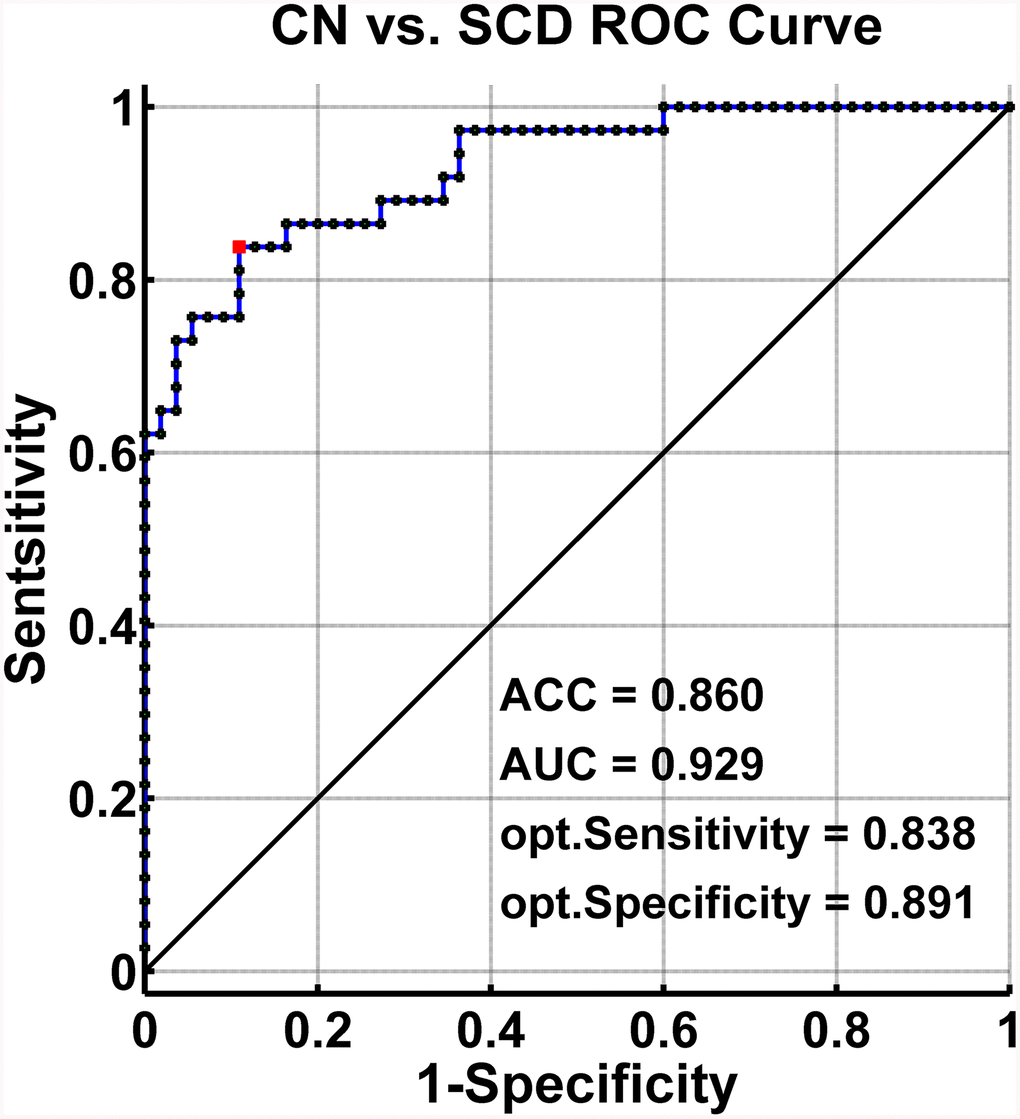
Figure 5. Classification of individuals as SCD versus CN by MRI-based “classifier”. The ROC curves hows the classification power in MRI-based “classifier” of SCD from CN. Note: the values of ACC, AUC, sensitivity, and specificity in lower right of the figure present the optimum values under the optimum combined index score (red point). Abbreviations: SCD, subjective cognitive decline; CN, healthy controls; AUC, area under the ROC curve; ACC, accuracy; Opt, optimum; ROC, receiver operating characteristic; MRI, magnetic resonance imaging.
Changes in HIPsub FC pre- v.s. post-rTMS (or sham rTMS)
The 2×2 repeated-measures ANOVA showed that there were significant interactions between group (real group and sham group) and stimulation (pre-rTMS and post-rTMS) in the alterations of HIPc and HIPp network connectivities (p < 0.05). In the HIPc network, SCD subjects showed a significantly reduced FC in the left parahippocampal gyrus at 2 weeks of post-rTMS compared with pre-rTMS (p< 0.05, 10000 bootstraps) (Figure 6A). In the HIPp network, SCD subjects had significantly lower FC in the left middle temporal gyrus at 2 weeks of post-rTMS in contrast with pre-rTMS (p< 0.05, 10000 bootstraps) (Figure 6B). However, no differences were found in the connectivity of HIPe, HIPc, and HIPp pre- v.s. post-sham rTMS (Figure 6).
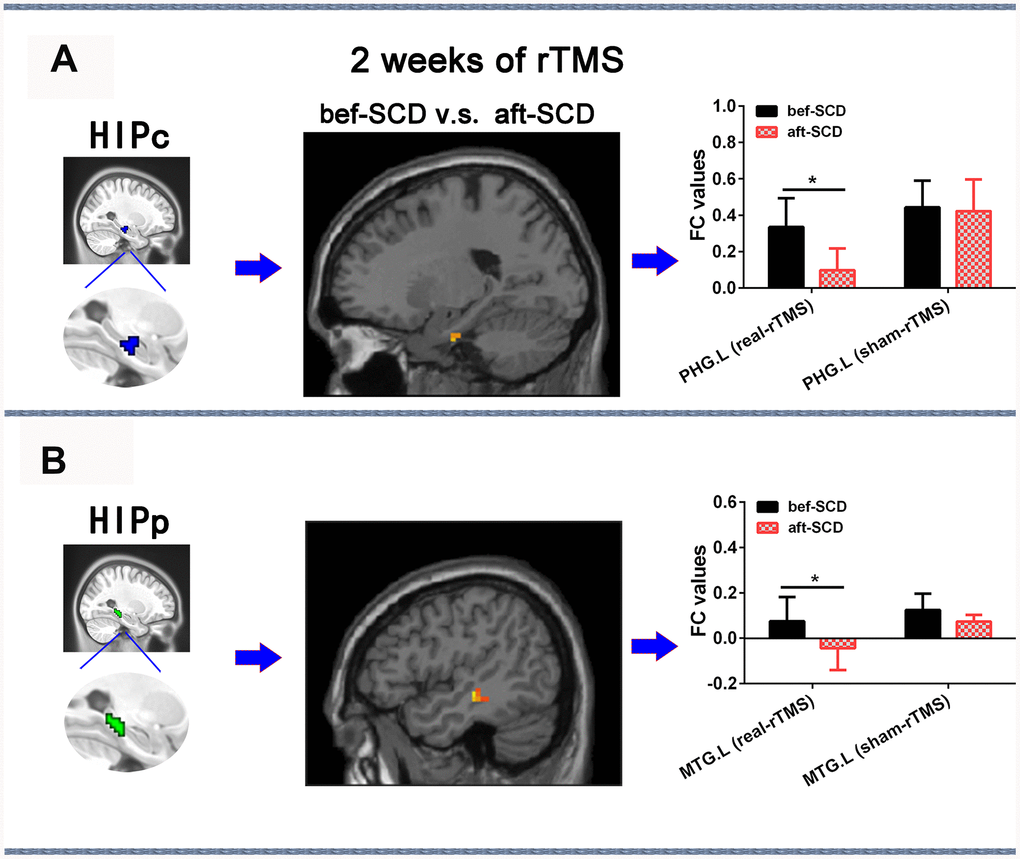
Figure 6. Changes in HIPsub network functional connectivity of SCD before and after 2 weeks of rTMS treatment controlling for age, sex, GM, and education. (A) HIPc seed, brain regions of HIPc functional connectivity changes, and quantitative changes on HIPc functional connectivity of SCD subjects after 2 weeks of rTMS treatment. (B) HIPp seed, brain regions of HIPp functional connectivity changes, and quantitative changes on HIPp functional connectivity of SCD subjects after 2 weeks of rTMS treatment. * p<0.05. Abbreviations: bef-SCD, subjective cognitive decline before rTMS treatment; aft-SCD, subjective cognitive decline after rTMS treatment; HIPc, hippocampal cognitive region; HIPp, hippocampal perceptual region; PHG.L, left parahippocampal gyrus; MTG.L, left middle temporal gyrus.
Changes of episodic memory pre- v.s. post-rTMS (or sham rTMS)
The 2×2 repeated-measures ANOVA also indicated that there were significant interactions between group (real group and sham group) and stimulation (pre-rTMS and post-rTMS) in the changes of AVLT-IR and AVLT-tot scores (p < 0.05). As shown in Figure 7, SCD subjects showed an improvement in episodic memory (AVLT) after 2 weeks ofreal rTMS treatment (10000 bootstraps; 17.25 (19.0~45.0) vs. 38.87 (16.0~59.0), T = -4.862, p = 0.002 for AVLT-IR; 6.00 (3.0~10.0) vs. 8.13 (3.0~12.0), T = -2.487, p = 0.042 for AVLT-5min-DR; 6.38 (3.0~11.0) vs. 7.38 (2.0~12.0), T = -1.283, p = 0.240 for AVLT-20min-DR; 29.63 (19.0~45.0) vs. 38.88 (16.0~59.0), T = -3.631, p = 0.008 for AVLTtot). Conversely, no differences were observed after 2 weeks of sham TMS treatment (10000 bootstraps, 15.00 (13.0~20.0) vs. 15.20 (14.0~17.0), T=-0.173, p = 0.871 for AVLT-IR; 4.60 (3.0~6.0) vs. 5.00 (4.0~6.0), T = -0.590, p = 0.587 for AVLT-5min-DR; 4.20 (3.0~6.0) vs. 4.80 (2.0~7.0), T = -0.739, p = 0.501 for AVLT-20min-DR; 23.80 (19.0~30.0) vs. 25.20 (21.0~29.0), T = -1.723, p = 0.160 for AVLTtot).
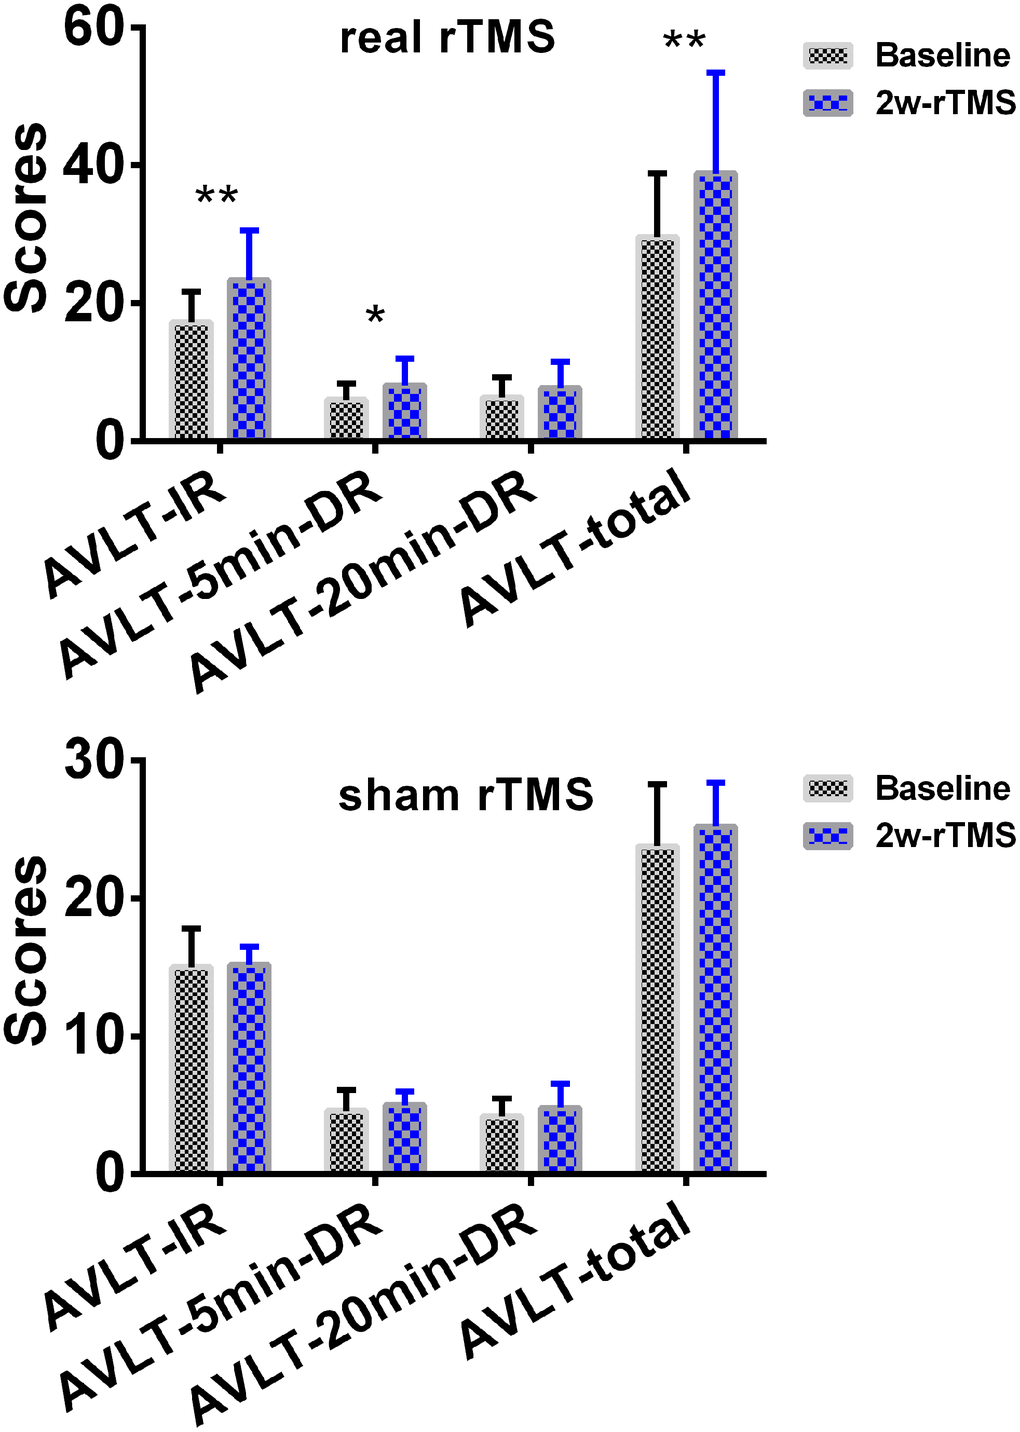
Figure 7. Changes of episodic memory in SCD subjects after 2 weeks of rTMS treatment. The line chart depicts the changes in episodic memory in SCD subjects before and after 2 weeks of rTMS treatment. To improve the statistical power, this study used a re-sampling method of stationary bootstrap (10,000 bootstrap samplings) to obtain significance between groups. * p<0.05, ** p<0.01. Abbreviations: CN, healthy controls; SCD, subjective cognitive decline; HIPc, hippocampal cognitive region; MTG.L, left middle temporal gyrus; FC, functional connectivity; 2w-rTMS, 2 weeks of rTMS. AVLT-IR, Auditory Verbal Learning Test - immediate recall; AVLT-5min-DR, Auditory Verbal Learning Test – 5-min delayed recall, AVLT-20min-DR, Auditory Verbal Learning Test –20-min delayed recall.
Changes of depression scores pre- v.s. post-rTMS (or sham rTMS)
There were no significant changes in HAMD scores before and after real-rTMS or sham-rTMS (2.88 vs. 2.13, t = 1.21, p = 0.265 for real-rTMS group; 3.20 vs. 2.80, t = 0.590, p = 0.587 for sham-rTMS group) (Supplementary Figure 4).
Discussion
To the best of our knowledge, the current study was the first to demonstrate that the dysfunctions in posterior hippocampus (i.e., HIPc and HIPp) network connectivity could be causally improved byrTMS modulation upon the precuneus in SCD subjects. Our findings further suggested that the precuneus-HIPsub circuit is a potential target circuit which could prevent the clinical progression of SCD to MCI/AD in therapeutic trials.
This study demonstrated that SCD subjects exhibited distinct patterns of alterations in the HIPsub network connectivity compared to controls. The SVM classifier showed that the abnormalities in brain memory networks had a high power to discriminate SCD from CN on an individual subject basis, with an ACC of 86.0%, AUC of 92.9%, sensitivity of 83.8%, and specificity of 89.1%. The present study identified a pathological circuit in HIPsub related to SCD patients which is consistent with the notion that HIPsub is involved in functional heterogeneity [12–14].
The HIPe network connectivity in SCD subjects was predominantly abnormal in the brain regions involved in numerous aspects of emotional processing, including the cerebellum [28, 29], anterior insula [28, 30], parahippocampal gyrus [28, 31], and fusiform gyrus [32]. Since SCD subjects are characterized by memory decline [33], which significantly amplifies the risk of AD [5], the aforementioned findings support that SCD subjects commonly have an abnormal emotional processing network connectivity. SCD subjects also had altered HIPc and HIPp network connectivity in the brain regions which are involved in memory processing namely the input and integration of sensory perception spatial information, visual object recognition memory, and the formation of episodic memory [14, 34–36].
Based on the processing theory of memory system, memory formation requires two neuropathways including occipital-temporal visual object processing pathway (the “what” stream) [36, 37] and parieto-temporal visuospatial pathway (the “where” stream) [38, 39]. Therefore, our results suggested that although self-reported memory declined within the normal range, there were abnormalities in the networks associated with memory processing in SCD patients. Hence, it can be inferred that aberrations in memory processing networks might precede the onset of clinical symptoms in SCD subjects.
The most interesting finding of the current study was that rTMS modulation directed upon the precuneus for 2 weeks could improve HIPc connectivity with the left parahippocampal gyrus and HIPp connectivity with the left middle temporal gyrus, potentially resulting in an improvement of episodic memory. Indeed, numerous studies have consistently indicated that the precuneus is a key node which forms part of the intrinsic hippocampal connectivity networks [14, 22, 25]. It was also previously reported that the precuneus serves as a key node for episodic memory deficits observed in early AD [26, 27], and is vulnerable to disruption which leads to the progression of MCI to AD [24]. Recent studies described the functional organization and connectivity in the human posteromedial cortex where the precuneus is located [40]. Moreover, the anatomical connectivity patterns of the precuneus potentially reflected its functional architecture [41].
In the past, the local rTMS stimulation of accessible network nodes was not only transmitted across synapses to distant parts but also to highly spatially specific interconnected nodes [18, 20, 21]. A recent task fMRI study has demonstrated a brain-behavior relationship whereby the structural network system dynamics showed direct relationships with brain activity associated with working memory [42]. Therefore, it is reasonable to speculate that the effects of rTMS might propagate in the hippocampus through synaptic transmission in the precuneus-HIPsub pathway.
The present study showed that rTMS modulation could improve the dysfunctions in posterior hippocampus (i.e., HIPc and HIPp) network connectivity related to memory processing but could not ameliorate the dysfunctions in anterior hippocampus (i.e., HIPe) network connectivity related to emotional processing. Previous studies have also indicated that the precision of memory recollection could be improved by stimulating the posterior cortical-hippocampal network [23] and parietal cortex connectivity with the hippocampus using rTMS [43]. Therefore, the precuneus-HIPsub pathway is believed to be an ideal target circuit for tailored rTMS intervention which could improve episodic memory decline in SCD.
The current study also showed that SCD subjects had significantly higher HAMD scores compared to controls although none of the subjects were depressed (HAMD score < 7). This could be explained by the confounding effect of depression on HIPsub connectivities alterations in SCD patients. Recently, Liew and colleagues investigated the independent risks of neurocognitive disorders associated with depression in a large sample study. They revealed that SCD and depression were independent risk factors for MCI/dementia and the combination of depression with SCD posed a higher risk than SCD alone [44].
Furthermore, several studies have indicated that TMS, such as electroconvulsive therapy (ECT), could be used for the treatment of depression [45–47]. However, to avoid depression as a confounding factor, only subjects with HAMD scores of less than 7 were recruited in the present study. Additionally, no correlations were found between depression scores and HIPsub connectivities. Our study also demonstrated that there were no significant changes in depression scores before and after real-rTMS or sham-rTMS. Therefore, it is plausible that the dysfunctions in HIPsub connectivities were not caused by depression in our study. In the future, depression scores between SCD and normal subjects should be further when investigating the effects of TMS on SCD subjects.
Limitations
There are several limitations to the present study. Firstly, a relatively small sample size was used. Based on the rTMS clinical trials, a single clinical symptom indicator was utilized as the clinical efficacy criteria. However, our results are reliable since we combined clinical response with functional connectivity as the efficacy criteria. In our study, rTMS was potentially efficient in restoring the dysfunctions in HIPc and HIPp network connectivity while HIPe network connectivity dysfunction persisted. In the future, a larger sample size is needed to explore the therapeutic pathways pertaining to the network connectivity of anterior hippocampus. Lastly, this study only investigated high-frequency effects [48]. Previous studies indicated that there were frequency-specific neuromodulation effects on improving episodic memory. Future studies need to further explore low-frequency effects on the improvement of episodic memory.
Conclusions
This study provides a novel experimental evidence on the correction of an aberration in the posterior hippocampus (HIPc and HIPp) related to cognitive and perceptual processing by modulating the precuneus in SCD patients. rTMS manipulation might prevent disease progression by improving memory in the earliest at-risk state of AD during clinical treatment trials. Our study further suggested that the precuneus-HIPsub circuit might be a useful target circuit for SCD subjects to design rationale strategies for therapeutic trials.
Materials and Methods
In the first cohort, a total of 99 subjects, comprised of 42 SCD patients and 57 healthy controls (CN), participated in the current study. All participants were selected from our in-home database: the Nanjing Brain Hospital-Alzheimer’s Disease Spectrum Neuroimaging Project (NBH-ADsnp) (Nanjing, China). Relevant information pertaining toNBH-ADsnpis summarized in supplementary materials (SI Methods S.2.). 3 SCD patients and 2 healthy controls were discarded from further analyses due to excessive head movement (see quality assurance section below), and incomplete or missing MRI data. The final analyses included 38 SCD patients and 55 CN. The detailed inclusion and exclusion criteria are described in supplementary materials (SI Methods S.2).
In the second cohort, a total of 20 SCD subjects, selected from the NBH-ADsnp database, participated in the clinical trial (No. ChiCTR2000034533). The participants underwent a 5-day, once-daily rTMS (or sham) course for 2 weeks in order to stimulate the precuneus in a sham-controlled design. Clinical measures, neuropsychological assessments, and MRI data were collected at baseline (pre-rTMS or sham intervention) and at the end of the 2 weeks of sham stimulation. Among the 20 SCD participants enrolled in the study, 16 subjects were randomly divided into real rTMS (8 SCD) or sham (8 SCD), and 13 subjects (8 SCD for real rTMS, 5 SCD for sham rTMS) completed the 2-week trial of rTMS course.
Ethical principle
This study was approved by the Human Participants Ethics Committee of the Affiliated Brain Hospital of Nanjing Medical University (No. 2018-KY010-01, No. 2020-KY010-02, and No. ChiCTR1900022287). Written informed consents were obtained from all subjects.
Neuropsychological assessments
In the present study, a standardized clinical interview and comprehensive neuropsychological assessment were performed in order to evaluate general cognitive function (MMSE, MoCA, and MDRS), executive function (TMT-B, Stoop-C, DST, VFT, and Similarity), information processing speed (TMT-A, Stoop-A, Stoop-B, and DSST), episodic memory (AVLT, LMT, and ROCFT-20-min-DR), and visuo-spatial function (ROCFT and CDT). Comprehensive neuropsychological assessments are summarized in supplementary materials (SI MethodsS.3).
MRI data acquisition
Detailed MRI data acquisition parameters included in the NBH-ADsnp database are summarized in supplementary materials (SI MethodsS.4).
fMRI data preprocessing
In this study, MATLAB 2015b and DPABI software [49] were used to preprocess all fMRI data. The image processing procedures were performed as described by Yan et al. [50] and are summarized in supplementary materials (SI Methods S.5). Overall, the image processing procedures included slice timing correction, head motion correction, realignment, nuisance covariate regression, normalization, smoothing, and filtering.
Quality assurance (QA)
Brain atrophy effect
Since significant hippocampal GM atrophies in SCD subjects were reported in the past [11, 51], the anatomical differences between our groups might influence the FCs of HIPsub. In order to elucidate this matter, we computed global intracranial volumes (ITV) based on native GM, WM, and CSF in both CN and SCD subjects by using in-home MATLAB codes. Furthermore, when computing the general linear model (GLM), ITV was taken as an additional covariate in order to investigate network connectivity differences of HIPsub between CN and SCD subjects.
Head motion effect
Three approaches were employed to control the effects of head motion, both at individual and group levels. Firstly, SCD subjects with excessive head motions (cumulative translation or rotation > 3.0 mm or 3.0°) were excluded. Afterwards, a Friston 24-parameter model was used to regress out head motion effects from the realigned data [52]. Secondly, a ‘scrubbing’ procedure was performed to scrub frames (volumes) with an excessively high whole-brain root mean square (RMS) signal change over time in the preprocessed fMRI data for each individual [53–55]. Furthermore, all volumes were regressed out with a framewise displacement (FD) greater than 0.2 mm as nuisance covariates, and any scan with 50% of volumes removed was discarded [56]. 1 CN was excluded due to excessive head movement. There were no significant differences in the head motion parameters between the subsequently included CN and SCD subjects (Table 1).
Strict multiple comparison correction strategy
A strict multiple comparison correction was performed in order to ensure reproducibility, test–retest reliability, and replicability on fMRI metrics [57]. Statistical maps were leveled using permutation test with Threshold-Free Cluster Enhancement (TFCE) [58] and false discovery rate (FDR) was implemented in DPABI [49]. For cluster-extent permutation tests, voxel thresholds were set as two-tailed, p< 0.02 (Z> 2.3). Lastly, we set a two-tailed, p< 0.05 threshold for our analyses (1,000 permutations in FDR evaluation).
Definition of hippocampal subregions
The definition of HIPsub employed throughout our study was originally designated by Robinson et al. [12] and Bai et al. [59], who previously used coactivation-based parcellation to reveal a subspecialization in the hippocampus using a data-driven method. Since both studies demonstrated that the right hippocampal segmentation was ambiguous using coactivation-based parcellation, we selected only the left HIPsub as regions of interest (ROI) (Supplementary Figure 2). The left hippocampus was then defined as three subregions (HIPe, HIPc, and HIPp).
Functional connectivity analyses
Firstly, we extracted the average time courses for all voxels within each HIPsub as the reference time course. Secondly, we performed voxel-wise cross-correlation analysis between the averaged time courses of all voxels within the seed HIPsub region and each voxel in the remainder of the whole brain within the group-specific GM mask. At last, we performed a Fisher's z-transform analysis to enhance the normality of the correlation coefficients.
rTMS protocol
rTMS was employed to stimulate the precuneus of all SCD participants using a Magstim Rapid2 magnetic stimulator with a 70-mm figure-8-shaped coil. The Pz site of the 10–20 electroencephalogram system was used to locate the precuneus, and the intersection tip of the two coil loops was placed at the Pz site to stimulate the precuneus [24].
rTMS was then applied at a frequency of 10 Hz, using total trains of 1000 stimuli (1000 pulses) and at an intensity of 100% of the motor threshold (MT). The MT was defined as the lowest intensity producing motor evoked potentials of greater than 50 μV in at least 5 out of 10 trials in the relaxed first dorsal interosseous (FDI) muscle of the contralateral (right) hand [60]. All participants received a total of 25 sessions of either rTMS or sham stimulation over the precuneus. Daily session consisted of a 4 s stimulation with an interval of 56 s. The entire session lasted for 25 minutes each day. The subjects received 5 sessions per week for 4 weeks (Monday-Friday for a 4-week period). In the sham rTMS group, the stimulation coil was flipped over (180 degrees from the original position) to provide an identical sound. The flipped coil also induced a tapping sensation on the scalp.
Adverse events of rTMS protocol
The participants did not report any adverse effects during the rTMS trial.
Statistical Analysis
Demographics and neuropsychological data
Statistical analyses were conducted by the Statistical Package for the Social Sciences (SPSS) software version 22.0 (IBM, Armonk, New York). Two-sample t-test and chi-square tests were computed so as to assess differences in demographic data, clinical, cognitive performance, ITV, and head rotation parameters between the SCD and CN subjects (p < 0.05).
Pattern classification based on altered HIPsub GM and FC
A support vector machine (SVM) approach was applied to further identify GM and network connectivity of altered HIPsub in SCD patients using the alterations in the identified ROIs as a biomarker to evaluate the extent to which we could distinguish SCD from CN subjects. A leave-one-out cross-validation (LOOCV) strategy was used to assess the generalization of this SVM classifier and measure its accuracy, sensitivity, and specificity. These findings demonstrated the presence of GM and network connectivity of altered HIPsub related to SCD patients and could explain the changes associated to SCD during rTMS treatment.
Sham v.s. real rTMS
Among the 13 SCD subjects with complete clinical assessments, usable sMRI and fMRI scan data at baseline, and 2 weeks of post-rTMS (or sham), 8 subjects were randomized to real rTMS and 5 subjects underwent sham rTMS. A two-sample t-test was performed to examine any differences in HIPsub FC alterations between pre-post real rTMS and pre-post sham rTMS. Pre-real-rTMS (or sham-rTMS) maps were subtracted from post-real-rTMS (or sham-rTMS) maps to generate maps of altered FC for each subject. In addition, the interactive effect of group (real group and sham group)×stimulation (before-rTMS and after-rTMS) was explored by a 2×2 repeated-measures ANOVA, with group as the between-subjects factor and stimulation as the within-subject factor for episodic memory, HAMD scores, and HIPsub connectivities.
Non-parametric statistics
The statistical power of our small sample size was improved by carrying out a re-sampling method comprising stationary bootstrap (10,000 bootstrap samplings) to obtain significant results in demographic data, clinical characteristics, cognitive performance, and FC of HIPsub between baseline assessment and 2 weeks of post-rTMS (sham rTMS) for all statistical analyses (i.e., chi-square test, two-sample t-test, Pearson correlation, and paired-sample t-test). All bootstrap analyses were conducted in SPSS 22.0 software. Supplementary Figure 1 shows the data analysis pipeline conducted in this study.
Supplementary Materials
Author Contributions
JC and XZ conceptualized and designed the study. JC, NM, GH, CX, WQ, WX, SC, RJ, WL, and FZ acquired, analyzed and/or interpreted the data. JC, Amdanee Nousayhah, FZ, NA and XZ drafted and revised the manuscript. All the authors approved the final manuscript.
Acknowledgments
We sincerely thank all the doctors at the Department of Rehabilitation, the Affiliated Brain Hospital of Nanjing Medical University for data collection.
Conflicts of Interest
The authors have no conflicts of interest to declare.
Funding
This study was supported by the National Key Research and Development Program of China (No. 2018YFC1314300), the National Natural Science Foundation of China (No. 81701675; 81971255); the Key Project supported by Medical Science and technology development Foundation, Nanjing Department of Health (No. JQX18005); the Cooperative Research Project of Southeast University-Nanjing Medical University (No. 2018DN0031); the Key Research and Development Plan (Social Development) Project of Jiangsu Province (No. BE2018608; BE2019610); Jiangsu Provincial Medical Talent project (ZDRCA2016075); the Innovation and Entrepreneurship Training Program for College Students in Jiangsu Province (No.201810312061X; 201910312035Z); and Key Scientific Research Projects of Colleges and Universities in Henan Province (No:18A190003).
References
- 1. Jessen F, Amariglio RE, Buckley RF, van der Flier WM, Han Y, Molinuevo JL, Rabin L, Rentz DM, Rodriguez-Gomez O, Saykin AJ, Sikkes SA, Smart CM, Wolfsgruber S, Wagner M. The characterisation of subjective cognitive decline. Lancet Neurol. 2020; 19:271–78. https://doi.org/10.1016/S1474-4422(19)30368-0 [PubMed]
- 2. Stewart R, Dufouil C, Godin O, Ritchie K, Maillard P, Delcroix N, Crivello F, Mazoyer B, Tzourio C. Neuroimaging correlates of subjective memory deficits in a community population. Neurology. 2008; 70:1601–07. https://doi.org/10.1212/01.wnl.0000310982.99438.54 [PubMed]
- 3. Striepens N, Scheef L, Wind A, Popp J, Spottke A, Cooper-Mahkorn D, Suliman H, Wagner M, Schild HH, Jessen F. Volume loss of the medial temporal lobe structures in subjective memory impairment. Dement Geriatr Cogn Disord. 2010; 29:75–81. https://doi.org/10.1159/000264630 [PubMed]
- 4. Scheef L, Spottke A, Daerr M, Joe A, Striepens N, Kölsch H, Popp J, Daamen M, Gorris D, Heneka MT, Boecker H, Biersack HJ, Maier W, et al. Glucose metabolism, gray matter structure, and memory decline in subjective memory impairment. Neurology. 2012; 79:1332–39. https://doi.org/10.1212/WNL.0b013e31826c1a8d [PubMed]
- 5. Jessen F, Wolfsgruber S, Wiese B, Bickel H, Mösch E, Kaduszkiewicz H, Pentzek M, Riedel-Heller SG, Luck T, Fuchs A, Weyerer S, Werle J, van den Bussche H, et al, and German Study on Aging, Cognition and Dementia in Primary Care Patients. AD dementia risk in late MCI, in early MCI, and in subjective memory impairment. Alzheimers Dement. 2014; 10:76–83. https://doi.org/10.1016/j.jalz.2012.09.017 [PubMed]
- 6. Buckley RF, Maruff P, Ames D, Bourgeat P, Martins RN, Masters CL, Rainey-Smith S, Lautenschlager N, Rowe CC, Savage G, Villemagne VL, Ellis KA, and AIBL study. Subjective memory decline predicts greater rates of clinical progression in preclinical Alzheimer’s disease. Alzheimers Dement. 2016; 12:796–804. https://doi.org/10.1016/j.jalz.2015.12.013 [PubMed]
- 7. Sperling RA, Aisen PS, Beckett LA, Bennett DA, Craft S, Fagan AM, Iwatsubo T, Jack CR
Jr , Kaye J, Montine TJ, Park DC, Reiman EM, Rowe CC, et al. Toward defining the preclinical stages of Alzheimer’s disease: recommendations from the national institute on aging-Alzheimer’s association workgroups on diagnostic guidelines for Alzheimer’s disease. Alzheimers Dement. 2011; 7:280–92. https://doi.org/10.1016/j.jalz.2011.03.003 [PubMed] - 8. Simon SS, Yokomizo JE, Bottino CM. Cognitive intervention in amnestic mild cognitive impairment: a systematic review. Neurosci Biobehav Rev. 2012; 36:1163–78. https://doi.org/10.1016/j.neubiorev.2012.01.007 [PubMed]
- 9. Bourrelier J, Kubicki A, Rouaud O, Crognier L, Mourey F. Mental rotation as an indicator of motor representation in patients with mild cognitive impairment. Front Aging Neurosci. 2015; 7:238. https://doi.org/10.3389/fnagi.2015.00238 [PubMed]
- 10. Meiberth D, Scheef L, Wolfsgruber S, Boecker H, Block W, Träber F, Erk S, Heneka MT, Jacobi H, Spottke A, Walter H, Wagner M, Hu X, Jessen F. Cortical thinning in individuals with subjective memory impairment. J Alzheimers Dis. 2015; 45:139–46. https://doi.org/10.3233/JAD-142322 [PubMed]
- 11. Perrotin A, de Flores R, Lamberton F, Poisnel G, La Joie R, de la Sayette V, Mézenge F, Tomadesso C, Landeau B, Desgranges B, Chételat G. Hippocampal subfield volumetry and 3D surface mapping in subjective cognitive decline. J Alzheimers Dis. 2015 (Suppl 1); 48:S141–50. https://doi.org/10.3233/JAD-150087 [PubMed]
- 12. Robinson JL, Barron DS, Kirby LA, Bottenhorn KL, Hill AC, Murphy JE, Katz JS, Salibi N, Eickhoff SB, Fox PT. Neurofunctional topography of the human hippocampus. Hum Brain Mapp. 2015; 36:5018–37. https://doi.org/10.1002/hbm.22987 [PubMed]
- 13. Davachi L. Item, context and relational episodic encoding in humans. Curr Opin Neurobiol. 2006; 16:693–700. https://doi.org/10.1016/j.conb.2006.10.012 [PubMed]
- 14. Chen J, Duan X, Shu H, Wang Z, Long Z, Liu D, Liao W, Shi Y, Chen H, Zhang Z. Differential contributions of subregions of medial temporal lobe to memory system in amnestic mild cognitive impairment: insights from fMRI study. Sci Rep. 2016; 6:26148. https://doi.org/10.1038/srep26148 [PubMed]
- 15. Liang L, Zhao L, Wei Y, Mai W, Duan G, Su J, Nong X, Yu B, Li C, Mo X, Wilson G, Deng D, Kong J. Structural and functional hippocampal changes in subjective cognitive decline from the community. Front Aging Neurosci. 2020; 12:64. https://doi.org/10.3389/fnagi.2020.00064 [PubMed]
- 16. Jessen F, Feyen L, Freymann K, Tepest R, Maier W, Heun R, Schild HH, Scheef L. Volume reduction of the entorhinal cortex in subjective memory impairment. Neurobiol Aging. 2006; 27:1751–56. https://doi.org/10.1016/j.neurobiolaging.2005.10.010 [PubMed]
- 17. Rastogi A, Cash R, Dunlop K, Vesia M, Kucyi A, Ghahremani A, Downar J, Chen J, Chen R. Modulation of cognitive cerebello-cerebral functional connectivity by lateral cerebellar continuous theta burst stimulation. Neuroimage. 2017; 158:48–57. https://doi.org/10.1016/j.neuroimage.2017.06.048 [PubMed]
- 18. Eldaief MC, Halko MA, Buckner RL, Pascual-Leone A. Transcranial magnetic stimulation modulates the brain’s intrinsic activity in a frequency-dependent manner. Proc Natl Acad Sci USA. 2011; 108:21229–34. https://doi.org/10.1073/pnas.1113103109 [PubMed]
- 19. Siddiqi SH, Taylor SF, Cooke D, Pascual-Leone A, George MS, Fox MD. Distinct symptom-specific treatment targets for circuit-based neuromodulation. Am J Psychiatry. 2020; 177:435–46. https://doi.org/10.1176/appi.ajp.2019.19090915 [PubMed]
- 20. Ruff CC, Bestmann S, Blankenburg F, Bjoertomt O, Josephs O, Weiskopf N, Deichmann R, Driver J. Distinct causal influences of parietal versus frontal areas on human visual cortex: evidence from concurrent TMS-fMRI. Cereb Cortex. 2008; 18:817–27. https://doi.org/10.1093/cercor/bhm128 [PubMed]
- 21. Halko MA, Farzan F, Eldaief MC, Schmahmann JD, Pascual-Leone A. Intermittent theta-burst stimulation of the lateral cerebellum increases functional connectivity of the default network. J Neurosci. 2014; 34:12049–56. https://doi.org/10.1523/JNEUROSCI.1776-14.2014 [PubMed]
- 22. Wang JX, Rogers LM, Gross EZ, Ryals AJ, Dokucu ME, Brandstatt KL, Hermiller MS, Voss JL. Targeted enhancement of cortical-hippocampal brain networks and associative memory. Science. 2014; 345:1054–57. https://doi.org/10.1126/science.1252900 [PubMed]
- 23. Nilakantan AS, Bridge DJ, Gagnon EP, VanHaerents SA, Voss JL. Stimulation of the posterior cortical-hippocampal network enhances precision of memory recollection. Curr Biol. 2017; 27:465–70. https://doi.org/10.1016/j.cub.2016.12.042 [PubMed]
- 24. Koch G, Bonnì S, Pellicciari MC, Casula EP, Mancini M, Esposito R, Ponzo V, Picazio S, Di Lorenzo F, Serra L, Motta C, Maiella M, Marra C, et al. Transcranial magnetic stimulation of the precuneus enhances memory and neural activity in prodromal Alzheimer’s disease. Neuroimage. 2018; 169:302–11. https://doi.org/10.1016/j.neuroimage.2017.12.048 [PubMed]
- 25. Kahn I, Andrews-Hanna JR, Vincent JL, Snyder AZ, Buckner RL. Distinct cortical anatomy linked to subregions of the medial temporal lobe revealed by intrinsic functional connectivity. J Neurophysiol. 2008; 100:129–39. https://doi.org/10.1152/jn.00077.2008 [PubMed]
- 26. Buckner RL, Andrews-Hanna JR, Schacter DL. The brain’s default network: anatomy, function, and relevance to disease. Ann N Y Acad Sci. 2008; 1124:1–38. https://doi.org/10.1196/annals.1440.011 [PubMed]
- 27. Raichle ME, MacLeod AM, Snyder AZ, Powers WJ, Gusnard DA, Shulman GL. A default mode of brain function. Proc Natl Acad Sci USA. 2001; 98:676–82. https://doi.org/10.1073/pnas.98.2.676 [PubMed]
- 28. Lindquist KA, Wager TD, Kober H, Bliss-Moreau E, Barrett LF. The brain basis of emotion: a meta-analytic review. Behav Brain Sci. 2012; 35:121–43. https://doi.org/10.1017/S0140525X11000446 [PubMed]
- 29. Adamaszek M, D’Agata F, Ferrucci R, Habas C, Keulen S, Kirkby KC, Leggio M, Mariën P, Molinari M, Moulton E, Orsi L, Van Overwalle F, Papadelis C, et al. Consensus paper: cerebellum and emotion. Cerebellum. 2017; 16:552–76. https://doi.org/10.1007/s12311-016-0815-8 [PubMed]
- 30. Zhang Y, Zhou W, Wang S, Zhou Q, Wang H, Zhang B, Huang J, Hong B, Wang X. The roles of subdivisions of human insula in emotion perception and auditory processing. Cereb Cortex. 2019; 29:517–28. https://doi.org/10.1093/cercor/bhx334 [PubMed]
- 31. McDonald AJ, Mott DD. Functional neuroanatomy of amygdalohippocampal interconnections and their role in learning and memory. J Neurosci Res. 2017; 95:797–820. https://doi.org/10.1002/jnr.23709 [PubMed]
- 32. Marshall CR, Hardy CJ, Russell LL, Bond RL, Sivasathiaseelan H, Greaves C, Moore KM, Agustus JL, van Leeuwen JE, Wastling SJ, Rohrer JD, Kilner JM, Warren JD. The functional neuroanatomy of emotion processing in frontotemporal dementias. Brain. 2019; 142:2873–87. https://doi.org/10.1093/brain/awz204 [PubMed]
- 33. Jessen F, Amariglio RE, van Boxtel M, Breteler M, Ceccaldi M, Chételat G, Dubois B, Dufouil C, Ellis KA, van der Flier WM, Glodzik L, van Harten AC, de Leon MJ, et al. A conceptual framework for research on subjective cognitive decline in preclinical Alzheimer's disease. Alzheimers Dement. 2014; 10:844–52. https://doi.org/10.1016/j.jalz.2014.01.001 [PubMed]
- 34. Alvarado MC, Bachevalier J. Comparison of the effects of damage to the perirhinal and parahippocampal cortex on transverse patterning and location memory in rhesus macaques. J Neurosci. 2005; 25:1599–609. https://doi.org/10.1523/JNEUROSCI.4457-04.2005 [PubMed]
- 35. Staresina BP, Duncan KD, Davachi L. Perirhinal and parahippocampal cortices differentially contribute to later recollection of object- and scene-related event details. J Neurosci. 2011; 31:8739–47. https://doi.org/10.1523/JNEUROSCI.4978-10.2011 [PubMed]
- 36. Eichenbaum H, Yonelinas AP, Ranganath C. The medial temporal lobe and recognition memory. Annu Rev Neurosci. 2007; 30:123–52. https://doi.org/10.1146/annurev.neuro.30.051606.094328 [PubMed]
- 37. Lavenex P, Suzuki WA, Amaral DG. Perirhinal and parahippocampal cortices of the macaque monkey: intrinsic projections and interconnections. J Comp Neurol. 2004; 472:371–94. https://doi.org/10.1002/cne.20079 [PubMed]
- 38. Suzuki WA, Amaral DG. Perirhinal and parahippocampal cortices of the macaque monkey: cortical afferents. J Comp Neurol. 1994; 350:497–533. https://doi.org/10.1002/cne.903500402 [PubMed]
- 39. Kravitz DJ, Saleem KS, Baker CI, Mishkin M. A new neural framework for visuospatial processing. Nat Rev Neurosci. 2011; 12:217–30. https://doi.org/10.1038/nrn3008 [PubMed]
- 40. Zhang Y, Fan L, Zhang Y, Wang J, Zhu M, Zhang Y, Yu C, Jiang T. Connectivity-based parcellation of the human posteromedial cortex. Cereb Cortex. 2014; 24:719–27. https://doi.org/10.1093/cercor/bhs353 [PubMed]
- 41. Wang J, Becker B, Wang L, Li H, Zhao X, Jiang T. Corresponding anatomical and coactivation architecture of the human precuneus showing similar connectivity patterns with macaques. Neuroimage. 2019; 200:562–74. https://doi.org/10.1016/j.neuroimage.2019.07.001 [PubMed]
- 42. Beynel L, Deng L, Crowell CA, Dannhauer M, Palmer H, Hilbig S, Peterchev AV, Luber B, Lisanby SH, Cabeza R, Appelbaum LG, Davis SW. Structural controllability predicts functional patterns and brain stimulation benefits associated with working memory. J Neurosci. 2020; 40:6770–78. https://doi.org/10.1523/JNEUROSCI.0531-20.2020 [PubMed]
- 43. Nilakantan AS, Mesulam MM, Weintraub S, Karp EL, VanHaerents S, Voss JL. Network-targeted stimulation engages neurobehavioral hallmarks of age-related memory decline. Neurology. 2019; 92:e2349–54. https://doi.org/10.1212/WNL.0000000000007502 [PubMed]
- 44. Liew TM. Depression, subjective cognitive decline, and the risk of neurocognitive disorders. Alzheimers Res Ther. 2019; 11:70. https://doi.org/10.1186/s13195-019-0527-7 [PubMed]
- 45. Baker KG. Treating depression in adults with transcranial magnetic stimulation. Nursing. 2020; 50:18–20. https://doi.org/10.1097/01.NURSE.0000659384.14292.90 [PubMed]
- 46. Miron JP, Sheen J, Mansouri F, Blumberger DM, Daskalakis ZJ, Vila-Rodriguez F, Downar J. The role of low-frequency repetitive transcranial magnetic stimulation in major depression: a call to increase the evidence base. Brain Stimul. 2020; 13:1296–97. https://doi.org/10.1016/j.brs.2020.06.013 [PubMed]
- 47. Thompson L. Treating major depression and comorbid disorders with transcranial magnetic stimulation. J Affect Disord. 2020; 276:453–60. https://doi.org/10.1016/j.jad.2020.07.025 [PubMed]
- 48. Davis SW, Luber B, Murphy DL, Lisanby SH, Cabeza R. Frequency-specific neuromodulation of local and distant connectivity in aging and episodic memory function. Hum Brain Mapp. 2017; 38:5987–6004. https://doi.org/10.1002/hbm.23803 [PubMed]
- 49. Yan CG, Wang XD, Zuo XN, Zang YF. DPABI: data processing & analysis for (resting-state) brain imaging. Neuroinformatics. 2016; 14:339–51. https://doi.org/10.1007/s12021-016-9299-4 [PubMed]
- 50. Yan CG, Craddock RC, Zuo XN, Zang YF, Milham MP. Standardizing the intrinsic brain: towards robust measurement of inter-individual variation in 1000 functional connectomes. Neuroimage. 2013; 80:246–62. https://doi.org/10.1016/j.neuroimage.2013.04.081 [PubMed]
- 51. Caillaud M, Hudon C, Boller B, Brambati S, Duchesne S, Lorrain D, Gagnon JF, Maltezos S, Mellah S, Phillips N, Belleville S, and Consortium for the Early Identification of Alzheimer’s Disease-Quebec. Evidence of a relation between hippocampal volume, white matter hyperintensities, and cognition in subjective cognitive decline and mild cognitive impairment. J Gerontol B Psychol Sci Soc Sci. 2020; 75:1382–92. https://doi.org/10.1093/geronb/gbz120 [PubMed]
- 52. Friston KJ, Williams S, Howard R, Frackowiak RS, Turner R. Movement-related effects in fMRI time-series. Magn Reson Med. 1996; 35:346–55. https://doi.org/10.1002/mrm.1910350312 [PubMed]
- 53. Sheline YI, Raichle ME, Snyder AZ, Morris JC, Head D, Wang S, Mintun MA. Amyloid plaques disrupt resting state default mode network connectivity in cognitively normal elderly. Biol Psychiatry. 2010; 67:584–87. https://doi.org/10.1016/j.biopsych.2009.08.024 [PubMed]
- 54. Power JD, Barnes KA, Snyder AZ, Schlaggar BL, Petersen SE. Spurious but systematic correlations in functional connectivity MRI networks arise from subject motion. Neuroimage. 2012; 59:2142–54. https://doi.org/10.1016/j.neuroimage.2011.10.018 [PubMed]
- 55. Van Dijk KR, Sabuncu MR, Buckner RL. The influence of head motion on intrinsic functional connectivity MRI. Neuroimage. 2012; 59:431–38. https://doi.org/10.1016/j.neuroimage.2011.07.044 [PubMed]
- 56. Brady RO
Jr , Gonsalvez I, Lee I, Öngür D, Seidman LJ, Schmahmann JD, Eack SM, Keshavan MS, Pascual-Leone A, Halko MA. Cerebellar-prefrontal network connectivity and negative symptoms in schizophrenia. Am J Psychiatry. 2019; 176:512–20. https://doi.org/10.1176/appi.ajp.2018.18040429 [PubMed] - 57. Chen X, Lu B, Yan CG. Reproducibility of R-fMRI metrics on the impact of different strategies for multiple comparison correction and sample sizes. Hum Brain Mapp. 2018; 39:300–18. https://doi.org/10.1002/hbm.23843 [PubMed]
- 58. Smith SM, Nichols TE. Threshold-free cluster enhancement: addressing problems of smoothing, threshold dependence and localisation in cluster inference. Neuroimage. 2009; 44:83–98. https://doi.org/10.1016/j.neuroimage.2008.03.061 [PubMed]
- 59. Bai T, Wei Q, Xie W, Wang A, Wang J, Ji GJ, Wang K, Tian Y. Hippocampal-subregion functional alterations associated with antidepressant effects and cognitive impairments of electroconvulsive therapy. Psychol Med. 2019; 49:1357–64. https://doi.org/10.1017/S0033291718002684 [PubMed]
- 60. Rossini PM, Burke D, Chen R, Cohen LG, Daskalakis Z, Di Iorio R, Di Lazzaro V, Ferreri F, Fitzgerald PB, George MS, Hallett M, Lefaucheur JP, Langguth B, et al. Non-invasive electrical and magnetic stimulation of the brain, spinal cord, roots and peripheral nerves: Basic principles and procedures for routine clinical and research application. An updated report from an I.F.C.N. Committee. Clin Neurophysiol. 2015; 126:1071–1107. https://doi.org/10.1016/j.clinph.2015.02.001 [PubMed]