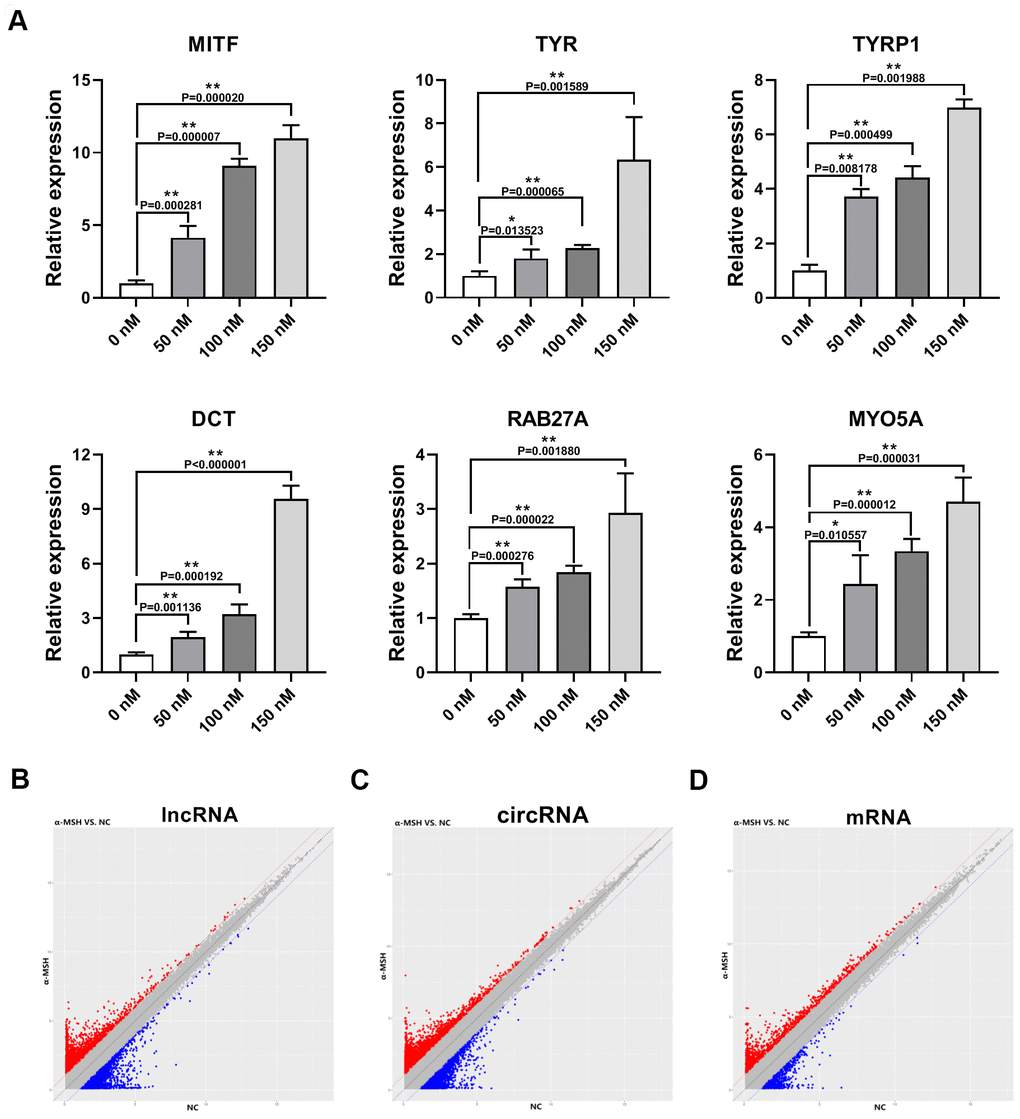
Figure 1.Differentially expressed lncRNAs, circRNAs, and mRNAs in α-MSH-treated melanocytes. (A) qRT-PCR was used to detect the expression of melanogenesis related genes (MITF, TYR, TYRP1, DCT, RAB27A, and MYO5A) in α-MSH-induced melanocytes. (B–D) Scatter plot of normalized expression levels for differentially expressed lncRNAs, circRNAs, and mRNAs, respectively. Red dots: upregulated lncRNAs, circRNAs, and mRNAs; Blue dots : downregulated lncRNAs, circRNAs, and mRNAs.