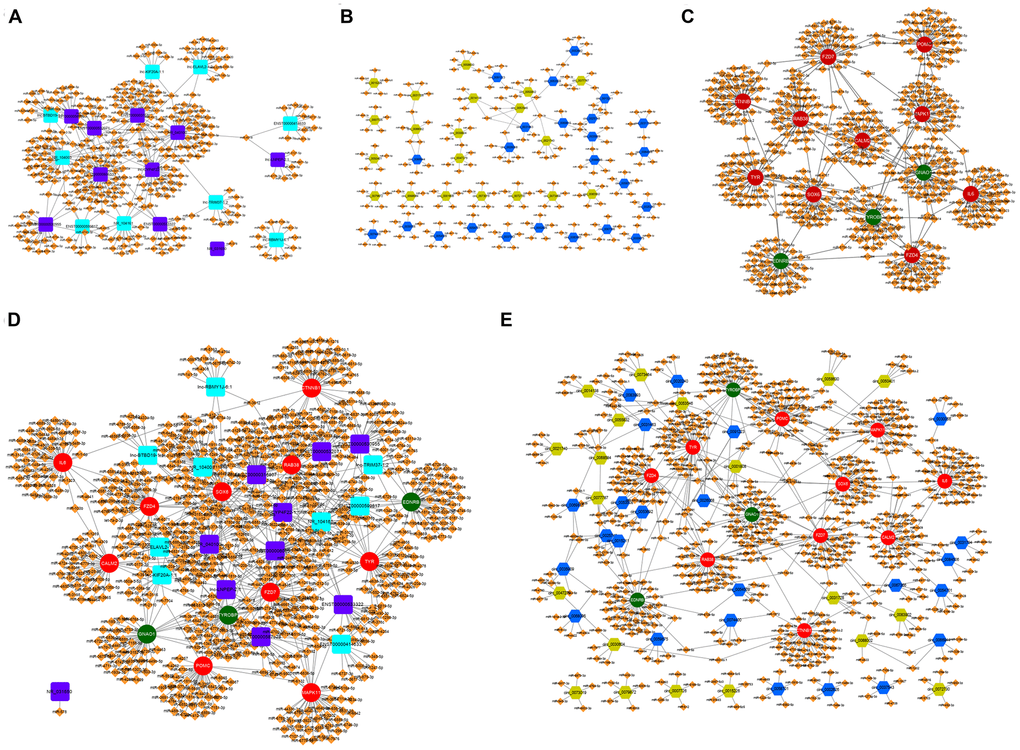
Figure 2.The lncRNA-miRNA-mRNA and circRNA-miRNA-mRNA ceRNA network in α-MSH-treated melanocytes. (A) Potential miRNA targets (Tot Score ≥160 or top ten Tot Score) of the differentially expressed lncRNAs with 5-fold change. (B) Potential miRNA targets (Top five high-binding sites) of the differentially expressed circRNAs with 5-fold change. (C) Potential miRNA targets (top 40 predicted miRNAs based on the score) of the differentially expressed mRNAs related to melanogenesis. (D, E) The lncRNA-miRNA-mRNA and circRNA-miRNA-mRNA ceRNA network involved in melanogenesis. Purple square: upregulated lncRNAs; Blue square: downregulated lncRNAs; Blue hexagon: upregulated circRNAs; Green six square: downregulated circRNAs; Red circle: upregulated mRNAs; Green circle: downregulated mRNAs; Orange diamond: miRNAs.