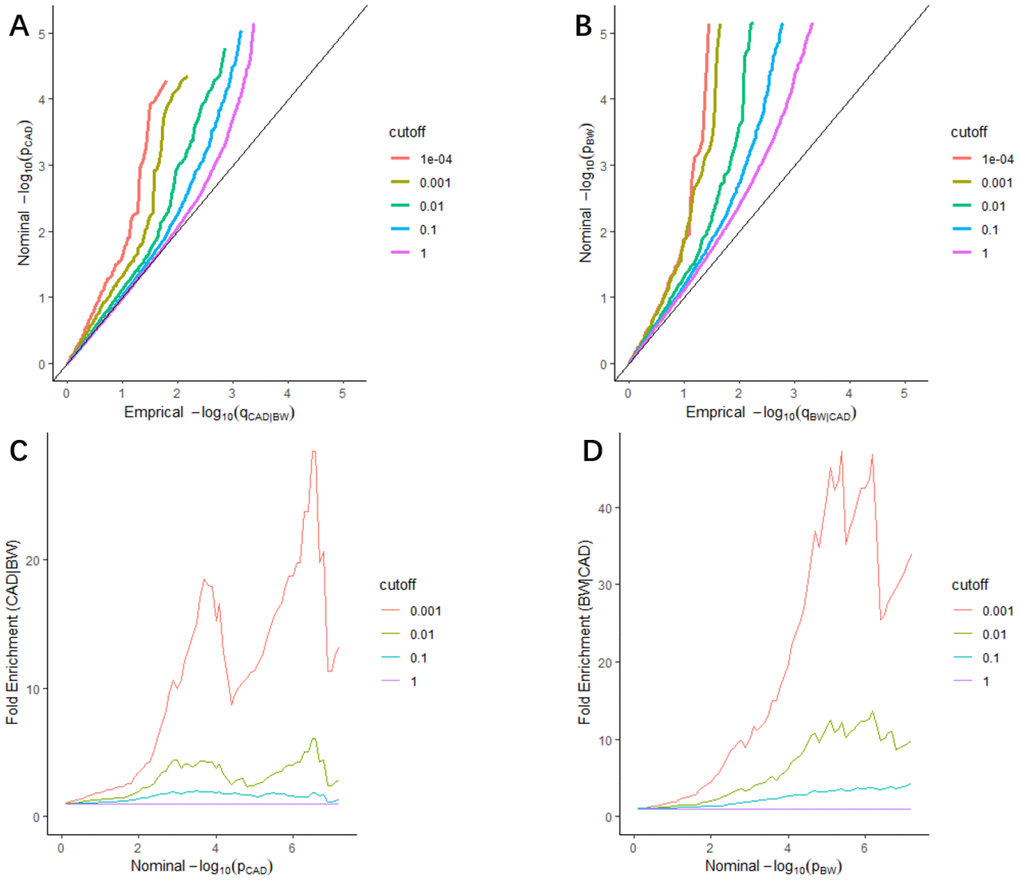
Figure 1.Stratified Q-Q plots and fold-enrichment plots. Stratified Q-Q plots of nominal vs. empirical -log10(p) values in principal trait below the standard GWAS threshold of p ≤ 5 × 10⁻⁸ as a function of the significance of the association with conditional trait at the level of p ≤ 1, p ≤ 0.1, p ≤ 0.01, p ≤ 0.001, and p ≤ 0.0001, respectively. (A) CAD as a function of the significance of the association with BW, and (B) BW as a function of the significance of the association with CAD. Fold-enrichment plots of enrichment vs nominal -log10(p) values (corrected for inflation) corresponding to levels of p ≤ 1, p ≤ 0.1, p ≤ 0.01, ≤ 0.001, respectively in (C) CAD below the standard GWAS threshold of p ≤ 5 × 10⁻⁸ as a function of significance of the association with BW; and in (D) BW below the standard GWAS threshold of p ≤ 5 × 10⁻⁸ as a function of significance with CAD. Dashed lines indicate the null-hypothesis.