


Introduction
Coronary artery disease (CAD) is characterized by the narrowing or obstruction of the coronary arteries, which can lead to chest pain, arrhythmia, heart failure, and even permanent heart damage [1]. In 2017, over 485 million people suffered from CAD, resulting in 17.8 million deaths [2, 3], making this disease the leading cause of morbidity and mortality worldwide [4].
Numerous studies have shown that early life experiences, including low birth weight (BW), may increase the risk of cardiovascular diseases [5–7]. Thus, the World Health Organization has classified low BW as a risk factor for CAD later in life [8]. However, the prevalence of CAD does not decrease with higher BW accompanied by improved living conditions [9]. In addition, many randomized controlled trials designed to improve BW revealed different results [10, 11], leaving the relationship between BW and CAD unclear.
CAD and BW are highly influenced by multiple genetic factors with heritability estimates over 30–60% [12] and 30–50% [13], respectively. With the development of genome-wide association studies (GWAS), more than 230 CAD-associated [14–19] and 80 BW-associated loci [20–22] have been detected. These loci describe only a small part of the genetic contribution [23, 24], leaving a large proportion of “missing heritability” unexplained [25]. Pleiotropy occurs when one gene or variant affects multiple phenotypes [26]. Among the human genome, more than 17% of genes and 5% of single-nucleotide polymorphisms (SNPs) show pleiotropic effects [27]. Considering the potential causal relationship, large genetic determination, pleiotropic effect, and missing heritability between CAD and BW, it is necessary to illuminate biological mechanisms and uncover novel associated genetic variants for both traits.
By leveraging the pleiotropic effect in related traits, a conditional false discovery rate (cFDR) method was developed without additional subjects recruitment [28]. This approach is cost-effective and could improve the identification of novel genetic loci underlying missing heritability, thereby elucidating genetic mechanisms associated with multiple phenotypes [29–32]. Furthermore, Mendelian randomization (MR) is an approach to investigate the potential causality between exposure and outcome using genetic instrumental variables [33]. As genetic variants are randomly distributed among the population and are generally independent of confounders, such analysis may reduce confounding bias and eliminate potential reversed causal relationship [34].
In this study, we applied cFDR and bi-directional MR analyses to two large and independent GWAS datasets aiming to 1) identify additional novel loci and the genetic pleiotropy of CAD and BW, and 2) estimate the causality between CAD and BW. Therefore, we can improve SNP detection, and clarify the shared mechanic relationship and overlapping genetic heritability between these two traits better.
Results
Pleiotropic enrichment estimation
We found leftward separations between each line (including the null line) in the stratified quantile-quantile (Q-Q) plots, which indicated the pleiotropy of CAD conditional on BW (Figure 1A), as well as BW conditional on CAD (Figure 1B). As shown in fold-enrichment plots (Figure 1C, 1D), distinct upward shifts from the baseline demonstrated a strong pleiotropic enrichment between BW and CAD. We observed the most notable pleiotropy with an enrichment fold greater than 40 in BW conditional on CAD.
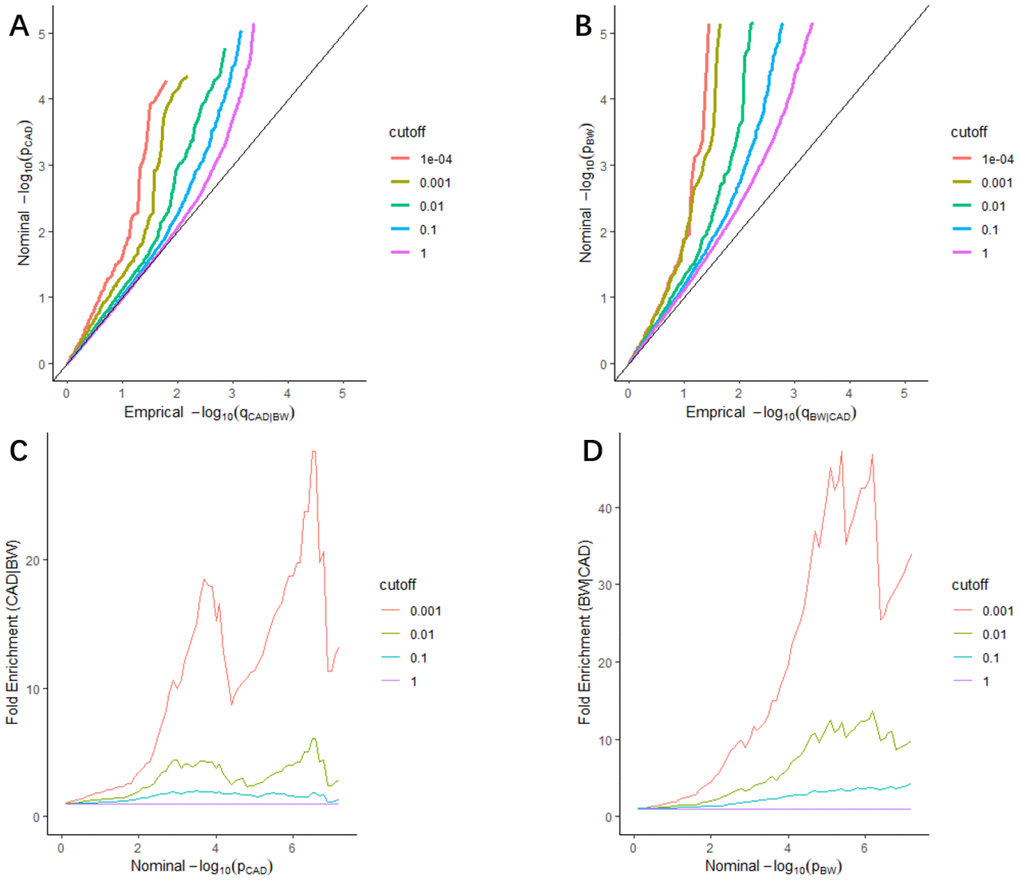
Figure 1. Stratified Q-Q plots and fold-enrichment plots. Stratified Q-Q plots of nominal vs. empirical -log10(p) values in principal trait below the standard GWAS threshold of p ≤ 5 × 10⁻⁸ as a function of the significance of the association with conditional trait at the level of p ≤ 1, p ≤ 0.1, p ≤ 0.01, p ≤ 0.001, and p ≤ 0.0001, respectively. (A) CAD as a function of the significance of the association with BW, and (B) BW as a function of the significance of the association with CAD. Fold-enrichment plots of enrichment vs nominal -log10(p) values (corrected for inflation) corresponding to levels of p ≤ 1, p ≤ 0.1, p ≤ 0.01, ≤ 0.001, respectively in (C) CAD below the standard GWAS threshold of p ≤ 5 × 10⁻⁸ as a function of significance of the association with BW; and in (D) BW below the standard GWAS threshold of p ≤ 5 × 10⁻⁸ as a function of significance with CAD. Dashed lines indicate the null-hypothesis.
Furthermore, the stratified Q-Q plots for CAD conditional on autism spectrum disorder (ASD) (Supplementary Figure 1A), and BW conditional on ASD (Supplementary Figure 1C) all showed no enrichment and vice versa (Supplementary Figure 1B, 1D), which can be the negative controls.
CAD-associated SNPs identified by cFDR
Conditional on BW, we identified 109 significant SNPs (cFDR ≤ 0.05) associated with CAD variation, which were located on 20 different chromosomes (1–17, 19, 21–22), annotated to 98 genes (Supplementary Table 1 and Figure 2A). We validated 22 SNPs that were statistically significant in the former CAD GWAS datasets [14–19]. Additionally, six SNPs associated with cardiovascular function were also validated in our research [35–38]. Excluding 26 SNPs that showed high linkage disequilibrium (LD) (r2 > 0.6) with the previous CAD-related loci, the remaining 55 SNPs were potentially novel to CAD (Supplementary Table 2). Using validation datasets, we found 111 significant SNPs for CAD, 73 of which (65.8%) were also significant in the original cFDR research (Supplementary Table 3).
We detected 16 SNPs associated with various metabolites (Supplementary Table 7), such as kynurenine, C18:1 sphingomyelin, and cholesterol, which affected the pathogenesis of CAD. Seven SNPs were associated with different proteins, and 27 SNPs showed significant metabolic quantitative trait locus (metaQTL) effects in the human serum. Notably, three novel SNPs, rs11244035, rs3811417, and rs624249, showed more than three metaQTL, protein QTL (pQTL), methylation QTL (meQTL), or expression QTL (eQTL) effects simultaneously (Table 1).
Table 1. Conjunction cFDR for 26 pleiotropic SNPs in CAD and BW (ccFDR ≤ 0.05).
| SNP | Chr | Pos | Alt | Gene | Annotation | metaQTL/pQTL/meQTL/eQTL | SNP Type | Gene Type | cFDR_CAD | cFDR_BW | ccFDR | ||||||||||||||||||||||||||||||||||||||||||||||||||||||||||||||||||||||||||||||||||||||||
| rs10774625 | 12 | 111472415 | A/T | ATXN2 | intronic | metaQTL/pQTL/meQTL/eQTL(3 hits) | CAD | CAD | 1.48E-08 | 3.06E-05 | 3.06E-05 | ||||||||||||||||||||||||||||||||||||||||||||||||||||||||||||||||||||||||||||||||||||||||
| rs11066301 | 12 | 112433568 | A/T | PTPN11 | intronic | metaQTL/meQTL/eQTL(1 hit) | CAD | CAD | 3.45E-05 | 6.50E-03 | 6.50E-03 | ||||||||||||||||||||||||||||||||||||||||||||||||||||||||||||||||||||||||||||||||||||||||
| rs11172113 | 12 | 57133500 | T/A | LRP1 | intronic | metaQTL/meQTL/eQTL(4 hits) | Novel | Novel | 3.56E-03 | 3.18E-02 | 3.18E-02 | ||||||||||||||||||||||||||||||||||||||||||||||||||||||||||||||||||||||||||||||||||||||||
| rs11206803 | 1 | 56411837 | C/G | AC119674.2 | intronic | meQTL | Novel | Novel | 2.02E-02 | 3.51E-02 | 3.51E-02 | ||||||||||||||||||||||||||||||||||||||||||||||||||||||||||||||||||||||||||||||||||||||||
| rs12148530 | 15 | 96542056 | T/A | 7SK | intergenic | Novel | Novel | 4.40E-02 | 1.64E-02 | 4.40E-02 | |||||||||||||||||||||||||||||||||||||||||||||||||||||||||||||||||||||||||||||||||||||||||
| rs12306172 | 12 | 54145221 | G/C | SMUG1 | intronic | eQTL(7 hits) | Novel | Novel | 1.37E-03 | 8.89E-05 | 1.37E-03 | ||||||||||||||||||||||||||||||||||||||||||||||||||||||||||||||||||||||||||||||||||||||||
| rs13035774 | 2 | 24135782 | C/G | FAM228B | intronic | meQTL/eQTL(29 hits) | Novel | Novel | 5.73E-03 | 4.35E-03 | 5.73E-03 | ||||||||||||||||||||||||||||||||||||||||||||||||||||||||||||||||||||||||||||||||||||||||
| rs1319869 | 15 | 98669256 | G/C | IGF1R | intronic | Novel | BW | 1.41E-03 | 1.85E-04 | 1.41E-03 | |||||||||||||||||||||||||||||||||||||||||||||||||||||||||||||||||||||||||||||||||||||||||
| rs1480933 | 4 | 119512093 | C/G | PDE5A | intronic | pQTL/eQTL(17 hits) | Novel | Novel | 4.43E-02 | 3.52E-02 | 4.43E-02 | ||||||||||||||||||||||||||||||||||||||||||||||||||||||||||||||||||||||||||||||||||||||||
| rs1861044 | 4 | 15537875 | A/T | CC2D2A | intronic | pQTL | Novel | Novel | 4.54E-02 | 3.25E-02 | 4.54E-02 | ||||||||||||||||||||||||||||||||||||||||||||||||||||||||||||||||||||||||||||||||||||||||
| rs2268310 | 7 | 44637499 | C/G | OGDH | intronic | meQTL | Novel | Novel | 3.85E-02 | 3.10E-02 | 3.85E-02 | ||||||||||||||||||||||||||||||||||||||||||||||||||||||||||||||||||||||||||||||||||||||||
| rs2339940 | 2 | 24028917 | G/C | MFSD2B | intronic | eQTL(22 hits) | Novel | Novel | 1.34E-03 | 1.67E-05 | 1.34E-03 | ||||||||||||||||||||||||||||||||||||||||||||||||||||||||||||||||||||||||||||||||||||||||
| rs3756668 | 5 | 68300260 | G/C | PIK3R1 | 3'-UTR | Novel | Novel | 1.32E-02 | 6.91E-04 | 1.32E-02 | |||||||||||||||||||||||||||||||||||||||||||||||||||||||||||||||||||||||||||||||||||||||||
| rs4233701 | 2 | 23706216 | G/C | KLHL29 | intronic | eQTL(15 hits) | Novel | Novel | 5.26E-03 | 2.81E-05 | 5.26E-03 | ||||||||||||||||||||||||||||||||||||||||||||||||||||||||||||||||||||||||||||||||||||||||
| rs4643791 | 4 | 119344464 | G/C | FABP2 | intergenic | eQTL(21 hits) | Novel | Novel | 4.76E-02 | 2.75E-02 | 4.76E-02 | ||||||||||||||||||||||||||||||||||||||||||||||||||||||||||||||||||||||||||||||||||||||||
| rs502467 | 3 | 172009573 | T/A | FNDC3B | intergenic | Novel | Novel | 2.58E-02 | 2.22E-02 | 2.58E-02 | |||||||||||||||||||||||||||||||||||||||||||||||||||||||||||||||||||||||||||||||||||||||||
| rs611003 | 11 | 69630516 | C/G | CCND1 | intergenic | Novel | Novel | 4.98E-02 | 9.20E-04 | 4.98E-02 | |||||||||||||||||||||||||||||||||||||||||||||||||||||||||||||||||||||||||||||||||||||||||
| rs630014 | 9 | 133274306 | A/T | ABO | intronic | metaQTL/meQTL/eQTL(9 hits) | Novel | CAD | 5.22E-03 | 1.16E-02 | 1.16E-02 | ||||||||||||||||||||||||||||||||||||||||||||||||||||||||||||||||||||||||||||||||||||||||
| rs6673081 | 1 | 155017119 | T/A | ZBTB7B | 3'-UTR | eQTL(8 hits) | Novel | BW | 8.98E-04 | 4.66E-08 | 8.98E-04 | ||||||||||||||||||||||||||||||||||||||||||||||||||||||||||||||||||||||||||||||||||||||||
| rs670950 | 19 | 43777410 | T/A | KCNN4 | intronic | eQTL(1 hit) | Novel | Novel | 3.15E-02 | 7.91E-03 | 3.15E-02 | ||||||||||||||||||||||||||||||||||||||||||||||||||||||||||||||||||||||||||||||||||||||||
| rs6713510 | 2 | 226169783 | G/C | LOC646736 | intronic | CAD | CAD | 6.65E-03 | 1.29E-02 | 1.29E-02 | |||||||||||||||||||||||||||||||||||||||||||||||||||||||||||||||||||||||||||||||||||||||||
| rs8039305 | 15 | 90879313 | T/A | FURIN | intronic | meQTL/eQTL(27 hits) | Novel | CAD | 3.77E-06 | 1.13E-06 | 3.77E-06 | ||||||||||||||||||||||||||||||||||||||||||||||||||||||||||||||||||||||||||||||||||||||||
| rs8105944 | 19 | 51047598 | C/G | KLK13 | intergenic | Novel | Novel | 4.04E-02 | 3.81E-02 | 4.04E-02 | |||||||||||||||||||||||||||||||||||||||||||||||||||||||||||||||||||||||||||||||||||||||||
| rs821551 | 1 | 155718789 | C/G | DAP3 | intronic | meQTL/eQTL(50 hits) | Novel | Novel | 1.08E-02 | 6.67E-04 | 1.08E-02 | ||||||||||||||||||||||||||||||||||||||||||||||||||||||||||||||||||||||||||||||||||||||||
| rs866919 | 10 | 30224354 | C/G | RP11 | intergenic | eQTL(1 hit) | Novel | Novel | 9.93E-03 | 9.87E-03 | 9.93E-03 | ||||||||||||||||||||||||||||||||||||||||||||||||||||||||||||||||||||||||||||||||||||||||
| rs965098 | 21 | 15185306 | G/C | JCAD | intergenic | Novel | Novel | 2.64E-02 | 2.35E-02 | 2.64E-02 | |||||||||||||||||||||||||||||||||||||||||||||||||||||||||||||||||||||||||||||||||||||||||
| Abbreviations: Chr, chromosome; Pos, chromosomal position (GRCh38/hg38); metaQTL, metabolic quantitative trait locus; pQTL, protein quantitative trait locus; meQTL, methylation quantitative trait locus; eQTL, expression quantitative trait locus; CAD, coronary artery disease; BW, birth weight; cFDR, conditional false discovery rate; ccFDR, conjunctional conditional false discovery rate. The allele was exhibited as reference allele/alter allele; SNP type and gene type means whether identified SNPs and genes have been reported in previous GWAS or in previous related cFDR studies. | |||||||||||||||||||||||||||||||||||||||||||||||||||||||||||||||||||||||||||||||||||||||||||||||||||
BW–associated SNPs identified by cFDR
Conditional on CAD, we identified 203 significant SNPs (cFDR ≤ 0.05) associated with BW variation, which were located on 22 chromosomes (1–22), annotated to 179 genes (Supplementary Table 4 and Figure 2B). We validated 27 SNPs that were statistically significant in the former BW GWAS datasets [20–22, 39], although 19 of the remaining 176 SNPs showed high LD (r2 > 0.6) with the previous BW-related loci (Supplementary Table 5). Using validation datasets, we found 229 significant SNPs for BW, 182 of which (79.5%) were also significant in the original cFDR research (Supplementary Table 6).
We detected 26 SNPs associated with various metabolites (Supplementary Table 7), five were associated with different proteins, and 31 showed significant meQTL effects in the human serum. In particular, four novel SNPs, rs143384, rs4875812, rs6700896, and rs8108865, showed more than three metaQTL, pQTL, meQTL, or eQTL effects simultaneously (Table 1).
Potentially pleiotropic SNPs identified using conjunction cFDR (ccFDR)
We calculated the ccFDR value and constructed the conjunction Manhattan plot to explore the pleiotropic loci between CAD and BW. (Figure 2C). Precisely 26 potentially pleiotropic loci that reached a significance threshold at ccFDR ≤ 0.05 were mapped to 13 chromosomes and annotated to 26 different genes. We validated three SNPs that were statistically significant in the original GWAS and CAD-related study, nine loci were also found to be related to other phenotypes (Supplementary Table 8). Using validation datasets, we found 17 pleiotropic SNPs for both traits, 12 of which (70.5%) were also pleiotropic loci in the original ccFDR research (Supplementary Table 9). We then detected 18 pleiotropic SNPs that showed more than one of the metaQTL, pQTL, meQTL, or eQTL effects. Particularly, rs10774625 showed all QTL effects simultaneously (Table 2).
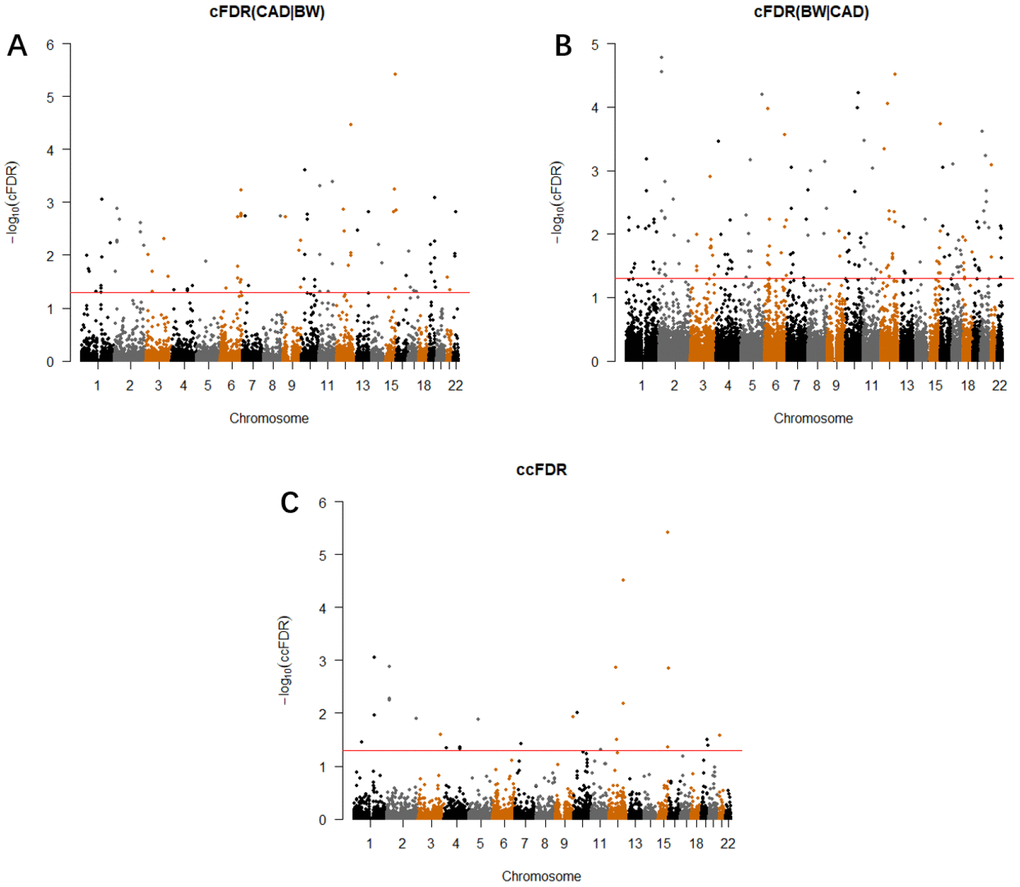
Figure 2. Conditional Manhattan plot. SNPs with -log10(cFDR) ≥ 1.3 (cFDR ≤ 0.05) for (A) CAD given BW (CAD|BW) and (B) BW given CAD (BW|CAD), or (C) -log10(ccFDR) ≥ 1.3 (ccFDR ≤ 0.05) are shown above the red line.
Table 2. Functional annotation for 11 SNPs showing significant effects in metaQTL, pQTL, meQTL, and eQTL.
| SNP | GENCODE genes | Traits | metaQTL | pQTL | meQTL (P) | eQTL Hits | Promoter histone marks | Enhancer histone marks | DNAse | Proteins bound | Motifs changed | ||||||||||||||||||||||||||||||||||||||||||||||||||||||||||||||||||||||||||||||||||||||||
| rs10774625 | ATXN2 | Pleiotropic | 9 hits | B2M | 4.10E-16 | 3 hits | 9 altered motifs | ||||||||||||||||||||||||||||||||||||||||||||||||||||||||||||||||||||||||||||||||||||||||||||
| rs11066301 | PTPN11 | Pleiotropic | 2 hits | 6.48E-12 | 1 hit | BLD | 6 altered motifs | ||||||||||||||||||||||||||||||||||||||||||||||||||||||||||||||||||||||||||||||||||||||||||||
| rs11172113 | LRP1 | Pleiotropic | SM C18:1 | 1.43E-07 | 4 hits | 8 tissues | 15 tissues | 17 tissues | FOXA1 | AP-2, Hic1, PU.1 | |||||||||||||||||||||||||||||||||||||||||||||||||||||||||||||||||||||||||||||||||||||||||
| rs630014 | ABO | Pleiotropic | 2 hits | 4.82E-09 | 9 hits | 4 tissues | GI, MUS | ESC,GI | Gm397, RP58 | ||||||||||||||||||||||||||||||||||||||||||||||||||||||||||||||||||||||||||||||||||||||||||
| rs11244035 | OBP2B | CAD | 8 hits | 1.37E-05 | 6 hits | Ik-1, Ik-2, NERF1a | |||||||||||||||||||||||||||||||||||||||||||||||||||||||||||||||||||||||||||||||||||||||||||||
| rs3811417 | RORC | CAD | nonanoylcarnitine | 5.46E-06 | 2 hits | 5 tissues | 12 tissues | CRVX | Arnt, Mxi1, Myc | ||||||||||||||||||||||||||||||||||||||||||||||||||||||||||||||||||||||||||||||||||||||||||
| rs624249 | SLC22A2 | CAD | X-12798 | 9.90E-05 | 3 hits | 4 tissues | |||||||||||||||||||||||||||||||||||||||||||||||||||||||||||||||||||||||||||||||||||||||||||||
| rs143384 | GDF5 | BW | CPN1 | 1.27E-07 | 47 hits | 9 tissues | 13 tissues | 16 tissues | Ascl2 | ||||||||||||||||||||||||||||||||||||||||||||||||||||||||||||||||||||||||||||||||||||||||||
| rs4875812 | MIR596 | BW | deoxycholate | 3.11E-12 | 3 hits | 4 tissues | 9 altered motifs | ||||||||||||||||||||||||||||||||||||||||||||||||||||||||||||||||||||||||||||||||||||||||||||
| rs6700896 | LEPR | BW | LEPR | 3.16E-07 | 1 hit | LIV | SKIN,SKIN | CTCF | GR, Myf, TCF12 | ||||||||||||||||||||||||||||||||||||||||||||||||||||||||||||||||||||||||||||||||||||||||||
| rs8108865 | FCHO1 | BW | HWESASXX | 1.27E-28 | 1 hit | BRN, BLD | NF-Y, NF-kappaB, Pou2f2 | ||||||||||||||||||||||||||||||||||||||||||||||||||||||||||||||||||||||||||||||||||||||||||||
| Abbreviations: metaQTL, metabolic quantitative trait locus; pQTL, protein quantitative trait locus; meQTL, methylation quantitative trait locus; eQTL, expression quantitative trait locus; DNAse, deoxyribonuclease; SM C18:1, C18:1 sphingomyelin; B2M, beta-2-microglobulin. | |||||||||||||||||||||||||||||||||||||||||||||||||||||||||||||||||||||||||||||||||||||||||||||||||||
Causality between BW and CAD
After instrument selection, LD clumping, variant extraction, and harmonization, 52 BW-CAD SNP pairs were selected when choosing BW as exposure (Supplementary Table 10). The MR-Egger regression test result (intercept: -0.0025, 95% confidence interval [CI]: -0.015 to 0.014, p = 0.973) suggested that there was no genetic confounding due to horizontal pleiotropy. The null-pleiotropy result was also confirmed using scatter plots and funnel plots (Supplementary Figures 2, 3). There was no apparent heterogeneity in our chosen SNPs, as evidenced by Cochran’s Q test (Supplementary Table 11). We found a negative association of BW to CAD from the inverse-variance weighted (IVW) estimates (odds ratio [OR] = 0.68, 95% CI: 0.59 to 0.80, p = 1.57× 10⁻⁶), which was consistent with all other MR methods (Table 3 and Figure 3). MR leave-one-out sensitivity analysis demonstrated that there was no influence of outlying and/or pleiotropic (Supplementary Figure 4). However, in the opposite direction, we found no causal relationship from CAD to BW (Supplementary Table 12).
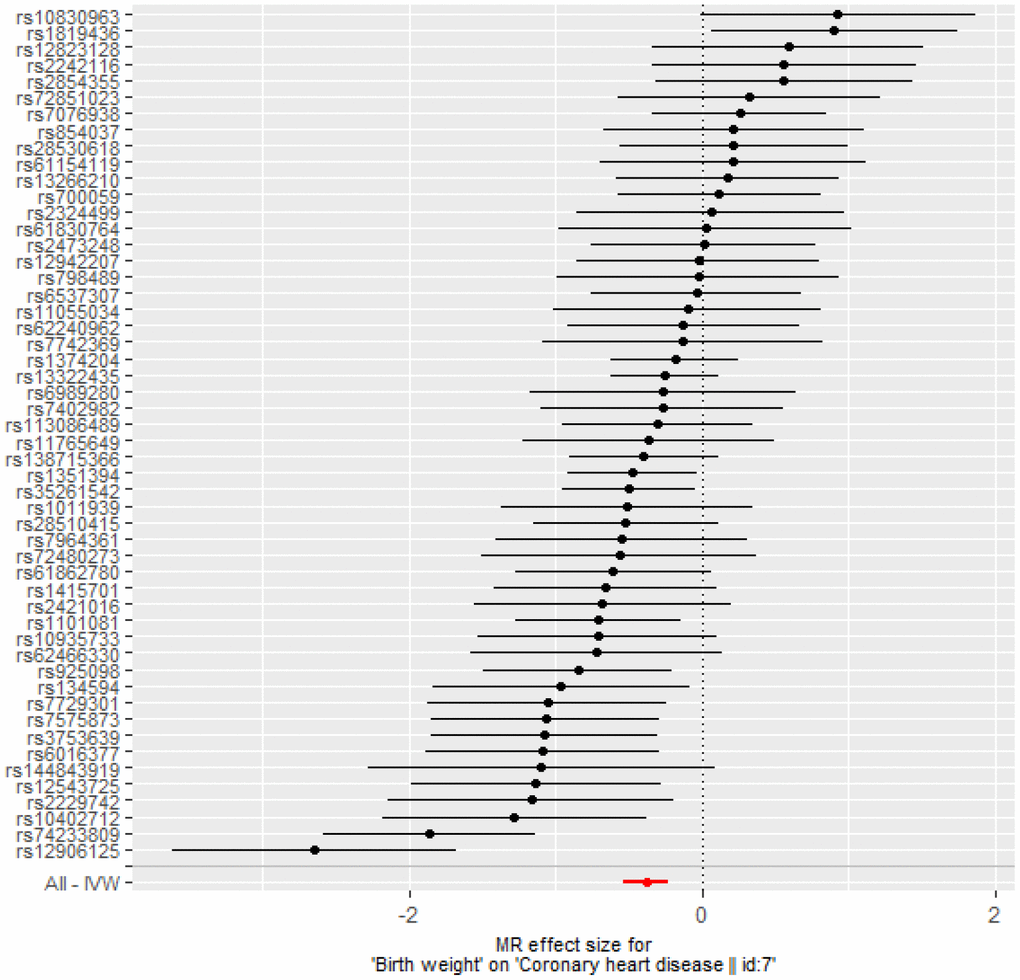
Figure 3. Forest plot of MR estimates BW on CAD. The estimated causal effect of BW on CAD was expressed by IVW (OR= 0.68, 95% CI: 0.59 to 0.80, p = 1.57× 10⁻⁶).
Table 3. Causal relationship from BW to CAD by Mendelian randomization analysis.
| Method | nSNP | OR (95%CI) | P_value | ||||||||||||||||||||||||||||||||||||||||||||||||||||||||||||||||||||||||||||||||||||||||||||||||
| Simple median | 52 | 0.72 (0.61, 0.84) | 2.89E-05 | ||||||||||||||||||||||||||||||||||||||||||||||||||||||||||||||||||||||||||||||||||||||||||||||||
| Weighted median | 52 | 0.68 (0.62, 0.76) | 1.33E-13 | ||||||||||||||||||||||||||||||||||||||||||||||||||||||||||||||||||||||||||||||||||||||||||||||||
| Weighted mode | 52 | 0.70 (0.55, 0.89) | 6.34E-03 | ||||||||||||||||||||||||||||||||||||||||||||||||||||||||||||||||||||||||||||||||||||||||||||||||
| Maximum likelihood | 52 | 0.69 (0.62, 0.76) | 8.57E-13 | ||||||||||||||||||||||||||||||||||||||||||||||||||||||||||||||||||||||||||||||||||||||||||||||||
| MR Egger | 52 | 0.63 (0.39, 1.01) | 6.22E-02 | ||||||||||||||||||||||||||||||||||||||||||||||||||||||||||||||||||||||||||||||||||||||||||||||||
| Inverse variance weighted | 52 | 0.68 (0.59, 0.80) | 1.57E-06 | ||||||||||||||||||||||||||||||||||||||||||||||||||||||||||||||||||||||||||||||||||||||||||||||||
| Abbreviations: nSNP, number of SNPs applied in the test; OR, odds ratio; 95%CI, 95% confidence interval. Detailed SNPs information are exhibited in Supplementary Table 10. | |||||||||||||||||||||||||||||||||||||||||||||||||||||||||||||||||||||||||||||||||||||||||||||||||||
Functional enrichment and protein-protein interaction analyses
We discovered significant enrichment of biological processes including “regulation of phospholipid metabolic process” (p = 1.10×10⁻⁴) and “negative regulation of lipid transport” (p = 2.40×10⁻⁴) for genes associated with CAD by conducting functional enrichment analysis. Moreover, genes associated with BW were enriched in gene ontology (GO) terms like “tube morphogenesis” (p = 1.20×10⁻⁴) and “regulation of multicellular organismal process” (p = 3.10×10⁻⁴). Interestingly, the results for pleiotropic variants showed a cluster of biological processes in insulin and kinase categories, which might contribute to body growth and the progression of CAD (Table 4).
Table 4. Gene ontology (GO) terms enriched for SNP-annotated genes with FDR ≤ 0.05.
| Traits | GO terms | Term description | Gene counts | FDR |
| CAD | GO:1903725 | regulation of phospholipid metabolic process | 7 | 1.10E-04 |
| GO:0032369 | negative regulation of lipid transport | 5 | 2.40E-04 | |
| GO:0019220 | regulation of phosphate metabolic process | 22 | 2.70E-04 | |
| GO:0032375 | negative regulation of cholesterol transport | 4 | 2.70E-04 | |
| GO:0051241 | negative regulation of multicellular organismal process | 18 | 2.70E-04 | |
| BW | GO:0035239 | tube morphogenesis | 19 | 1.20E-04 |
| GO:0051239 | regulation of multicellular organismal process | 42 | 3.10E-04 | |
| GO:0030154 | cell differentiation | 47 | 4.30E-04 | |
| GO:0035295 | tube development | 20 | 4.30E-04 | |
| GO:0072359 | circulatory system development | 20 | 4.30E-04 | |
| Pleiotropic | GO:0043560 | insulin receptor substrate binding | 3 | 1.20E-04 |
| GO:0005158 | insulin receptor binding | 3 | 4.30E-04 | |
| GO:0043559 | insulin binding | 2 | 2.20E-03 | |
| GO:0016538 | cyclin-dependent protein serine/threonine kinase regulator activity | 2 | 3.60E-02 | |
| GO:0043548 | phosphatidylinositol 3-kinase binding | 2 | 3.60E-02 |
According to the protein-protein interaction network for CAD (Supplementary Figure 5A), proteins such as FURIN, FLT1, PLG, LDLR, and APOE were closely connected, and have been demonstrated to affect cardiovascular function [14, 40–42]. Similarly, in the BW network (Supplementary Figure 5B), proteins including ADRB1, ADCY5, ESR1, EPAS1, and CDKAL1 were closely connected and have been demonstrated to affect BW [21, 43–45].
Discussion
In this study, we incorporated summary statistics from two independent GWAS datasets and discovered 109 and 203 SNPs associated with CAD and BW, respectively. By performing the ccFDR method, we further detected 26 pleiotropic loci associated with both phenotypes. Following a bi-directional MR analysis and functional annotation, we confirmed the causal relationship from BW to CAD and speculated the underlying shared genetic mechanisms between these two traits.
Notably, we identified 11 CAD- and/or BW-associated SNPs that showed more than three of the metaQTL, pQTL, meQTL, or eQTL effects. These functional loci might have a great effect on the pathogenesis of CAD and/or BW. For example, rs11172113 is located in the intron of LRP1, a member of the low-density lipoprotein receptor family, which regulates extracellular proteolytic activities [46]. LRP1 plays a pivotal role in mediating inflammation and efferocytosis [47], and mouse studies have shown that LRP1 knockout leads to diminished vessel integrity and high-density lipoprotein secretion [48]. Another study proved that LRP1 regulates food intake and energy homeostasis by acting as a co-activator of PPARγ [49]. Moreover, the lipidomic analysis demonstrated that the metabolite C18:1 sphingomyelin, which is associated with rs11172113, was enhanced in CAD patients compared to that in the control group [50]. Another longitudinal prospective study revealed that the alteration of sphingomyelin metabolism is associated with BW percentiles [51], suggesting a potentially crucial role for this SNP in both traits.
Furthermore, we identified one pleiotropic locus, rs10774625, showing metaQTL, pQTL, eQTL, and meQTL effects simultaneously. rs10774625 is located in the intron of ATXN2. One population-based GWAS demonstrated that the ATXN2-SH3 region contributes to changes in the retinal venular caliber, an endophenotype of the microcirculation related to clinical cardiovascular diseases [52]. Animal experiments supported the role of ATXN2 in translational regulation as well as embryonic development [53]. Another ATXN2 knockdown experiment demonstrated that mice lacking ATXN2 develop dysfunction in energy metabolism and weight regulation [54, 55]. It has been reported that rs10774625 is associated with the kynurenine metabolite pathway (KP) [56]. Evidence indicates that the activation of indoleamine 2,3-dioxygenase, the inducible enzyme in KP, is closely limited by endothelial cells [57], vascular smooth muscle cells [58], and dendritic cells [59], all of which play vital roles in cardiac pathophysiology [60]. Epidemiologically, it was shown that the concentration of kynurenine is associated with body weight indexes in a European cohort of more than 1000 people [61]. An immunohistochemistry study also detected that the kynurenine-to-tryptophan ratio limits the expression of inflammatory markers in the adipose tissue, which is correlated with body weight [62]. In addition, beta-2-microglobulin (B2M) is associated with rs10774625, which reduces the capacity for energy conversion and restricts intrauterine growth, resulting in low BW [63], and is also implicated in the pathogenesis of CAD [64]. These facts indicated that rs10774625 (representing gene ATXN2) might be essential in linking the pathogenesis between CAD and BW.
According to the functional enrichment results, we could also hypothesize the possible shared pathogenesis mechanisms between CAD and BW. GO terms including “regulation of phospholipid metabolic process”, “regulation of multicellular organismal process”, and “insulin receptor binding,” have important impacts on metabolic abnormalities, such as impaired fasting glucose [65], dyslipidemia, and hypertension [66], which could contribute to the increased risk for both traits.
Our study has some strengths. First, we improved the identification of potential CAD- and BW-associated SNPs and detected several pleiotropic loci in both traits. Following MR analysis, we assessed the causal effect between these two related traits. Second, we took into account ASD, which is unlikely to be correlated with CAD and BW, for a “control trait” enrichment analysis, which provided a baseline to examine pleiotropic enrichment and statistically validate the novel findings in our study. Third, evidence from metaQTL, pQTL, eQTL, and meQTL effects suggested a possible explanation for the etiology of CAD and/or BW and improved the interpretability of the results.
Additionally, our study includes some limitations. First, we were unable to link the genetic findings to clinical measures due to the lack of raw datasets for individual clinical outcomes. However, our study aimed to identify potential novel SNPs and explore the overlapping biological mechanisms between CAD and BW. We hope that our findings can be validated via functional experiments or fine-mapping studies. Second, although we confirmed the causal relationship from BW to CAD, the causalities of metabolomics, proteomics, and methylation between these two traits are unclear. Nevertheless, this problem could be solved by a follow-up multivariable MR study.
Conclusions
In conclusion, by applying the cFDR and bi-directional MR analyses to two strongly associated traits, we detected significant pleiotropic SNPs of potential functions for CAD and/or BW and estimated the causal relationship from BW to CAD. These findings provide a better understanding of the shared genetic mechanisms between CAD and BW, which might suggest a novel research direction for early disease prevention and subsequent treatment.
Materials and Methods
GWAS data sources
The first CAD GWAS was obtained from the Coronary Artery Disease Genome-wide Replication and Meta-analysis plus The Coronary Artery Disease Genetics (CARDIoGRAMplusC4D) Consortium. This meta-analysis of 48 multiple ancestry studies involved more than 8.6 million SNPs from 60,801 cases and 123,504 controls [18]. The first BW dataset conducted by the Early Growth Genetics (EGG) Consortium consisted of 45 multiple ancestry studies including 321,223 subjects. As the control trait, the ASD dataset, collected by the Psychiatric Genomics Consortium, contained 15,954 participants with European ancestry (7,387 ASD cases and 8,567 controls) [67]. For validation, two other CAD and BW datasets were used. The validation CAD dataset, comprising 10,801 cases and 137,914 controls, was collected by the CARDIoGRAMplusC4D Consortium [17]. The validation BW dataset, including 153,781 subjects, was collected by the EGG Consortium [21]. All datasets contained the summary statistics of each locus and the conducted genomic control [17, 18, 21, 22, 67].
Data processing
First, two GWAS datasets were combined and 8,285,296 common SNPs with summary statistics remained for both CAD and BW phenotypes. Then, we performed LD-based pruning (r2 ≤ 0.2) using HapMap III genotypes as a reference, and the SNP of the pair with longer allele frequency was retained [31, 68]. After merging and pruning, 141,779 variants were prepared for further analysis.
Pleiotropic enrichment evaluation
We constructed stratified Q-Q plots to estimate the pleiotropic enrichment in two related phenotypes using the “ggplot2” R package. In this study, -log10(p) which means the nominal p-value and -log10(q) which means the empirical quantile were plotted on the Y- and X-axes, respectively, at different significance levels (p ≤ 1, p ≤ 0.1, p ≤ 0.01, p ≤ 0.001, and p ≤ 0.0001). Under the null hypothesis, plots would fall on the line Y=X, and the enrichment of pleiotropic loci could be evaluated by the degree of leftward deviation from the null line. Additionally, we constructed fold-enrichment plots as a supplement for the Q-Q plots. Fold-enrichment and -log10(p) were plotted on the Y- and X-axes, respectively, at different significance levels (p ≤ 1, p ≤ 0.1, p ≤ 0.01, and p ≤ 0.001) for CAD and BW. Pleiotropy could be visually observed via an upward deflection from the baseline (for the group including all SNPs (p = 1)).
Calculation of cFDR and ccFDR values
The cFDR method was used to estimate the possibility that a random SNP was not associated with the primary trait, given that its strength for the conditional traits was below the threshold [28]. This was an extension of the original FDR framework, applied for the cross-trait analysis [69]. Specifically, we computed cFDR for each SNP, selecting CAD as the primary phenotype given its association with BW (CAD|BW) and vice versa (BW|CAD). To detect the pleiotropic loci for both traits, we calculated the ccFDR value, the maximum of the two cFDR values. The ccFDR value indicated that the possibility that a given SNP was false positively related to two traits (CAD and BW) simultaneously. The thresholds for cFDR and ccFDR were set at 0.05. Detailed steps of this approach have been described by Andreassen et al. [29].
Bi-directional MR analysis
To determine the relationship between BW and CAD, we performed a bi-directional MR analysis using the “TwoSampleMR” R package [70]. First, SNPs that were genome-wide significant (p ≤ 5x10⁻⁸) in the exposure GWAS dataset were selected as genetic variants. To ensure that the instruments for exposure were independent, we performed LD-based clumping (r2 > 0.001) and only retained the SNP with a lower p-value [68, 71]. Then, we extracted summary-level statistics for each selected SNP from the outcome trait and removed the SNPs related to the outcome phenotype (p ≤ 5x10⁻⁸). The summary associations of candidate genetic variants were harmonized as described previously [72]. Finally, MR was conducted using IVW, simple median, weighted median, weighted mode, maximum likelihood, and MR-Egger approaches. BW and CAD were used as exposure and outcome measures, respectively, to identify the causal direction. The datasets used in the MR analysis were the same as that in the original cFDR analysis (The first CAD and BW datasets). To investigate whether any SNP had an outlying and/or pleiotropic influence, we also performed a leave-one-out sensitivity analysis.
Functional annotation and protein-protein interaction analyses
Online tools HaploReg (http://compbio.mit.edu/HaploReg) and RegulomeDB (http://www.regulomedb.org/) were applied to map each of the identified significant SNPs to nearby genes, corresponding DNA features, and regulatory elements. Next, we detected whether they possessed metaQTL, pQTL, meQTL, or eQTL effects. To obtain the metaQTL and pQTL hits, we applied the web-based software SNiPA (http://www.snipa.org/), meQTL and eQTL information were collected from Bonder’s study [73] and HaploReg, respectively.
We used the GOEAST software to detect statistically overrepresented GO terms within the selected gene sets [74]. Meanwhile, using the STRING database, we conducted protein-protein interaction analyses to investigate the interaction and functional relationships of the identified CAD- and/or BW-related genes [75].
Supplementary Materials
Author Contributions
Xinrui Wu conceived the study, performed data analysis, interpretation and wrote the manuscript. Xu Lin, Qi Li, and Zun Wang were responsible for data collection and analysis. Na Zhang and Mengyuan Tian contributed to the manuscript. Xiaolei Wang conducted experiments. Hongwen Deng gave constructive suggestions during the whole process. Hongzhuan Tan provided guidance in study design, organized the investigation and is the corresponding author. All authors have read and approved the final manuscript before submission.
Conflicts of Interest
The authors declare that they have no conflicts of interest.
Funding
This research was supported by the National Natural Science Foundation of China [No.81373088, No.81773535], China Scholarship Council [No.201806371067], the graduate student scientific research innovation project of Central South University [2019zzts328], the National Institutes of Health [R01AR069055, U19AG055373, P20GM109036, R01AG061917], and the Edward G. Schlieder Endowment fund from Tulane University.
References
- 1. Thomas H, Diamond J, Vieco A, Chaudhuri S, Shinnar E, Cromer S, Perel P, Mensah GA, Narula J, Johnson CO, Roth GA, Moran AE. Global atlas of cardiovascular disease 2000-2016: the path to prevention and control. Glob Heart. 2018; 13:143–63. https://doi.org/10.1016/j.gheart.2018.09.511 [PubMed]
- 2. GBD 2017 Disease and Injury Incidence and Prevalence Collaborators. Global, regional, and national incidence, prevalence, and years lived with disability for 354 diseases and injuries for 195 countries and territories, 1990-2017: a systematic analysis for the global burden of disease study 2017. Lancet. 2018; 392:1789–858. https://doi.org/10.1016/S0140-6736(18)32279-7 [PubMed]
- 3. GBD 2017 Causes of Death Collaborators. Global, regional, and national age-sex-specific mortality for 282 causes of death in 195 countries and territories, 1980-2017: a systematic analysis for the global burden of disease study 2017. Lancet. 2018; 392:1736–88. https://doi.org/10.1016/S0140-6736(18)32203-7 [PubMed]
- 4. Benjamin EJ, Blaha MJ, Chiuve SE, Cushman M, Das SR, Deo R, de Ferranti SD, Floyd J, Fornage M, Gillespie C, Isasi CR, Jiménez MC, Jordan LC, et al, and American Heart Association Statistics Committee and Stroke Statistics Subcommittee. Heart disease and stroke statistics-2017 update: a report from the American heart association. Circulation. 2017; 135:e146–603. https://doi.org/10.1161/CIR.0000000000000485 [PubMed]
- 5. Gluckman PD, Hanson MA, Bateson P, Beedle AS, Law CM, Bhutta ZA, Anokhin KV, Bougnères P, Chandak GR, Dasgupta P, Smith GD, Ellison PT, Forrester TE, et al. Towards a new developmental synthesis: adaptive developmental plasticity and human disease. Lancet. 2009; 373:1654–57. https://doi.org/10.1016/S0140-6736(09)60234-8 [PubMed]
- 6. Sun D, Wang T, Heianza Y, Huang T, Shang X, Lv J, Li S, Harville E, Chen W, Fonseca V, Qi L. Birthweight and cardiometabolic risk patterns in multiracial children. Int J Obes (Lond). 2018; 42:20–27. https://doi.org/10.1038/ijo.2017.196 [PubMed]
- 7. Tam CH, Wang Y, Luan J, Lee HM, Luk AO, Tutino GE, Tong PC, Ko GT, Ozaki R, Tam WH, Kong AP, So WY, Chan JC, Ma RC. Non-linear relationship between birthweight and cardiometabolic risk factors in Chinese adolescents and adults. Diabet Med. 2015; 32:220–25. https://doi.org/10.1111/dme.12630 [PubMed]
- 8. Organization WH. Strategic priorities of the WHO Cardiovascular Disease programme. https://www.who.int/cardiovascular_diseases/priorities/en.
- 9. Chung RY, Schooling CM, Cowling BJ, Leung GM. How does socioeconomic development affect risk of mortality? an age-period-cohort analysis from a recently transitioned population in China. Am J Epidemiol. 2010; 171:345–56. https://doi.org/10.1093/aje/kwp378 [PubMed]
- 10. Nossier SA, Naeim NE, El-Sayed NA, Abu Zeid AA. The effect of zinc supplementation on pregnancy outcomes: a double-blind, randomised controlled trial, Egypt. Br J Nutr. 2015; 114:274–85. https://doi.org/10.1017/S000711451500166X [PubMed]
- 11. Potdar RD, Sahariah SA, Gandhi M, Kehoe SH, Brown N, Sane H, Dayama M, Jha S, Lawande A, Coakley PJ, Marley-Zagar E, Chopra H, Shivshankaran D, et al. Improving women’s diet quality preconceptionally and during gestation: effects on birth weight and prevalence of low birth weight—a randomized controlled efficacy trial in India (Mumbai maternal nutrition project). Am J Clin Nutr. 2014; 100:1257–68. https://doi.org/10.3945/ajcn.114.084921 [PubMed]
- 12. Andreassen OA, Djurovic S, Thompson WK, Schork AJ, Kendler KS, O’Donovan MC, Rujescu D, Werge T, van de Bunt M, Morris AP, McCarthy MI, Roddey JC, McEvoy LK, et al, and International Consortium for Blood Pressure GWAS, and Diabetes Genetics Replication and Meta-analysis Consortium, and Psychiatric Genomics Consortium Schizophrenia Working Group. Improved detection of common variants associated with schizophrenia by leveraging pleiotropy with cardiovascular-disease risk factors. Am J Hum Genet. 2013; 92:197–209. https://doi.org/10.1016/j.ajhg.2013.01.001 [PubMed]
- 13. Clausson B, Lichtenstein P, Cnattingius S. Genetic influence on birthweight and gestational length determined by studies in offspring of twins. BJOG. 2000; 107:375–81. https://doi.org/10.1111/j.1471-0528.2000.tb13234.x [PubMed]
- 14. Deloukas P, Kanoni S, Willenborg C, Farrall M, Assimes TL, Thompson JR, Ingelsson E, Saleheen D, Erdmann J, Goldstein BA, Stirrups K, König IR, Cazier JB, et al, and CARDIoGRAMplusC4D Consortium, and DIAGRAM Consortium, and CARDIOGENICS Consortium, and MuTHER Consortium, and Wellcome Trust Case Control Consortium. Large-scale association analysis identifies new risk loci for coronary artery disease. Nat Genet. 2013; 45:25–33. https://doi.org/10.1038/ng.2480 [PubMed]
- 15. Coronary Artery Disease (C4D) Genetics Consortium. A genome-wide association study in europeans and south Asians identifies five new loci for coronary artery disease. Nat Genet. 2011; 43:339–44. https://doi.org/10.1038/ng.782 [PubMed]
- 16. Howson JM, Zhao W, Barnes DR, Ho WK, Young R, Paul DS, Waite LL, Freitag DF, Fauman EB, Salfati EL, Sun BB, Eicher JD, Johnson AD, et al, and CARDIoGRAMplusC4D, and EPIC-CVD. Fifteen new risk loci for coronary artery disease highlight arterial-wall-specific mechanisms. Nat Genet. 2017; 49:1113–19. https://doi.org/10.1038/ng.3874 [PubMed]
- 17. Nelson CP, Goel A, Butterworth AS, Kanoni S, Webb TR, Marouli E, Zeng L, Ntalla I, Lai FY, Hopewell JC, Giannakopoulou O, Jiang T, Hamby SE, et al, and EPIC-CVD Consortium, CARDIoGRAMplusC4D, and UK Biobank CardioMetabolic Consortium CHD working group. Association analyses based on false discovery rate implicate new loci for coronary artery disease. Nat Genet. 2017; 49:1385–91. https://doi.org/10.1038/ng.3913 [PubMed]
- 18. Nikpay M, Goel A, Won HH, Hall LM, Willenborg C, Kanoni S, Saleheen D, Kyriakou T, Nelson CP, Hopewell JC, Webb TR, Zeng L, Dehghan A, et al. A comprehensive 1,000 genomes-based genome-wide association meta-analysis of coronary artery disease. Nat Genet. 2015; 47:1121–30. https://doi.org/10.1038/ng.3396 [PubMed]
- 19. Schunkert H, König IR, Kathiresan S, Reilly MP, Assimes TL, Holm H, Preuss M, Stewart AF, Barbalic M, Gieger C, Absher D, Aherrahrou Z, Allayee H, et al, and Cardiogenics, and CARDIoGRAM Consortium. Large-scale association analysis identifies 13 new susceptibility loci for coronary artery disease. Nat Genet. 2011; 43:333–38. https://doi.org/10.1038/ng.784 [PubMed]
- 20. Freathy RM, Mook-Kanamori DO, Sovio U, Prokopenko I, Timpson NJ, Berry DJ, Warrington NM, Widen E, Hottenga JJ, Kaakinen M, Lange LA, Bradfield JP, Kerkhof M, et al, and Genetic Investigation of ANthropometric Traits (GIANT) Consortium, and Meta-Analyses of Glucose and Insulin-related traits Consortium, and Wellcome Trust Case Control Consortium, and Early Growth Genetics (EGG) Consortium. Variants in ADCY5 and near CCNL1 are associated with fetal growth and birth weight. Nat Genet. 2010; 42:430–35. https://doi.org/10.1038/ng.567 [PubMed]
- 21. Horikoshi M, Beaumont RN, Day FR, Warrington NM, Kooijman MN, Fernandez-Tajes J, Feenstra B, van Zuydam NR, Gaulton KJ, Grarup N, Bradfield JP, Strachan DP, Li-Gao R, et al, and CHARGE Consortium Hematology Working Group, and Early Growth Genetics (EGG) Consortium. Genome-wide associations for birth weight and correlations with adult disease. Nature. 2016; 538:248–52. https://doi.org/10.1038/nature19806 [PubMed]
- 22. Warrington NM, Beaumont RN, Horikoshi M, Day FR, Helgeland Ø, Laurin C, Bacelis J, Peng S, Hao K, Feenstra B, Wood AR, Mahajan A, Tyrrell J, et al, and EGG Consortium. Maternal and fetal genetic effects on birth weight and their relevance to cardio-metabolic risk factors. Nat Genet. 2019; 51:804–14. https://doi.org/10.1038/s41588-019-0403-1 [PubMed]
- 23. Magnus P, Gjessing HK, Skrondal A, Skjaerven R. Paternal contribution to birth weight. J Epidemiol Community Health. 2001; 55:873–77. https://doi.org/10.1136/jech.55.12.873 [PubMed]
- 24. Zdravkovic S, Wienke A, Pedersen NL, Marenberg ME, Yashin AI, De Faire U. Heritability of death from coronary heart disease: a 36-year follow-up of 20 966 Swedish twins. J Intern Med. 2002; 252:247–54. https://doi.org/10.1046/j.1365-2796.2002.01029.x [PubMed]
- 25. Pei YF, Zhang L, Papasian CJ, Wang YP, Deng HW. On individual genome-wide association studies and their meta-analysis. Hum Genet. 2014; 133:265–79. https://doi.org/10.1007/s00439-013-1366-4 [PubMed]
- 26. Stearns FW. One hundred years of pleiotropy: a retrospective. Genetics. 2010; 186:767–73. https://doi.org/10.1534/genetics.110.122549 [PubMed]
- 27. Sivakumaran S, Agakov F, Theodoratou E, Prendergast JG, Zgaga L, Manolio T, Rudan I, McKeigue P, Wilson JF, Campbell H. Abundant pleiotropy in human complex diseases and traits. Am J Hum Genet. 2011; 89:607–18. https://doi.org/10.1016/j.ajhg.2011.10.004 [PubMed]
- 28. Andreassen OA, Thompson WK, Schork AJ, Ripke S, Mattingsdal M, Kelsoe JR, Kendler KS, O'Donovan MC, Rujescu D, Werge T, Sklar P, Chen CH, McEvoy L, et al, and Psychiatric Genomics Consortium (PGC), and Bipolar Disorder and Schizophrenia Working Groups. Improved detection of common variants associated with schizophrenia and bipolar disorder using pleiotropy-informed conditional false discovery rate. PLoS Genet. 2013; 9:e1003455. https://doi.org/10.1371/journal.pgen.1003455 [PubMed]
- 29. Greenbaum J, Deng HW. A statistical approach to fine mapping for the identification of potential causal variants related to bone mineral density. J Bone Miner Res. 2017; 32:1651–58. https://doi.org/10.1002/jbmr.3154 [PubMed]
- 30. Hu Y, Tan LJ, Chen XD, Liu Z, Min SS, Zeng Q, Shen H, Deng HW. Identification of novel potentially pleiotropic variants associated with osteoporosis and obesity using the cFDR method. J Clin Endocrinol Metab. 2018; 103:125–38. https://doi.org/10.1210/jc.2017-01531 [PubMed]
- 31. Lin X, Peng C, Greenbaum J, Li ZF, Wu KH, Ao ZX, Zhang T, Shen J, Deng HW. Identifying potentially common genes between dyslipidemia and osteoporosis using novel analytical approaches. Mol Genet Genomics. 2018; 293:711–23. https://doi.org/10.1007/s00438-017-1414-1 [PubMed]
- 32. Zhang Q, Wu KH, He JY, Zeng Y, Greenbaum J, Xia X, Liu HM, Lv WQ, Lin X, Zhang WD, Xi YL, Shi XZ, Sun CQ, Deng HW. Novel common variants associated with obesity and type 2 diabetes detected using a cFDR method. Sci Rep. 2017; 7:16397. https://doi.org/10.1038/s41598-017-16722-6 [PubMed]
- 33. Smith GD, Ebrahim S. ‘Mendelian randomization’: can genetic epidemiology contribute to understanding environmental determinants of disease? Int J Epidemiol. 2003; 32:1–22. https://doi.org/10.1093/ije/dyg070 [PubMed]
- 34. Lawlor DA, Harbord RM, Sterne JA, Timpson N, Davey Smith G. Mendelian randomization: using genes as instruments for making causal inferences in epidemiology. Stat Med. 2008; 27:1133–63. https://doi.org/10.1002/sim.3034 [PubMed]
- 35. Lv WQ, Zhang X, Zhang Q, He JY, Liu HM, Xia X, Fan K, Zhao Q, Shi XZ, Zhang WD, Sun CQ, Deng HW. Novel common variants associated with body mass index and coronary artery disease detected using a pleiotropic cFDR method. J Mol Cell Cardiol. 2017; 112:1–7. https://doi.org/10.1016/j.yjmcc.2017.08.011 [PubMed]
- 36. Peng C, Shen J, Lin X, Su KJ, Greenbaum J, Zhu W, Lou HL, Liu F, Zeng CP, Deng WF, Deng HW. Genetic sharing with coronary artery disease identifies potential novel loci for bone mineral density. Bone. 2017; 103:70–77. https://doi.org/10.1016/j.bone.2017.06.016 [PubMed]
- 37. Wang Z, Qiu C, Lin X, Zhao LJ, Liu Y, Wu X, Wang Q, Liu W, Li K, Deng HW, Tang SY, Shen H. Identification of novel functional CpG-SNPs associated with type 2 diabetes and coronary artery disease. Mol Genet Genomics. 2020; 295:607–19. https://doi.org/10.1007/s00438-020-01651-3 [PubMed]
- 38. Zhang Q, Liu HM, Lv WQ, He JY, Xia X, Zhang WD, Deng HW, Sun CQ. Additional common variants associated with type 2 diabetes and coronary artery disease detected using a pleiotropic cFDR method. J Diabetes Complications. 2018; 32:1105–12. https://doi.org/10.1016/j.jdiacomp.2018.09.003 [PubMed]
- 39. Zeng CP, Chen YC, Lin X, Greenbaum J, Chen YP, Peng C, Wang XF, Zhou R, Deng WM, Shen J, Deng HW. Increased identification of novel variants in type 2 diabetes, birth weight and their pleiotropic loci. J Diabetes. 2017; 9:898–907. https://doi.org/10.1111/1753-0407.12510 [PubMed]
- 40. Brænne I, Civelek M, Vilne B, Di Narzo A, Johnson AD, Zhao Y, Reiz B, Codoni V, Webb TR, Foroughi Asl H, Hamby SE, Zeng L, Trégouët DA, et al, and Leducq Consortium CAD Genomics. Prediction of causal candidate genes in coronary artery disease loci. Arterioscler Thromb Vasc Biol. 2015; 35:2207–17. https://doi.org/10.1161/ATVBAHA.115.306108 [PubMed]
- 41. Byars SG, Huang QQ, Gray LA, Bakshi A, Ripatti S, Abraham G, Stearns SC, Inouye M. Genetic loci associated with coronary artery disease harbor evidence of selection and antagonistic pleiotropy. PLoS Genet. 2017; 13:e1006328. https://doi.org/10.1371/journal.pgen.1006328 [PubMed]
- 42. López-Mejías R, Corrales A, Vicente E, Robustillo-Villarino M, González-Juanatey C, Llorca J, Genre F, Remuzgo-Martínez S, Dierssen-Sotos T, Miranda-Filloy JA, Huaranga MA, Pina T, Blanco R, et al. Influence of coronary artery disease and subclinical atherosclerosis related polymorphisms on the risk of atherosclerosis in rheumatoid arthritis. Sci Rep. 2017; 7:40303. https://doi.org/10.1038/srep40303 [PubMed]
- 43. Horikoshi M, Yaghootkar H, Mook-Kanamori DO, Sovio U, Taal HR, Hennig BJ, Bradfield JP, St Pourcain B, Evans DM, Charoen P, Kaakinen M, Cousminer DL, Lehtimäki T, et al, and Meta-Analyses of Glucose- and Insulin-related traits Consortium (MAGIC), and Early Growth Genetics (EGG) Consortium. New loci associated with birth weight identify genetic links between intrauterine growth and adult height and metabolism. Nat Genet. 2013; 45:76–82. https://doi.org/10.1038/ng.2477 [PubMed]
- 44. van der Valk RJ, Kreiner-Møller E, Kooijman MN, Guxens M, Stergiakouli E, Sääf A, Bradfield JP, Geller F, Hayes MG, Cousminer DL, Körner A, Thiering E, Curtin JA, et al, and Early Genetics and Lifecourse Epidemiology (EAGLE) Consortium, and Genetic Investigation of ANthropometric Traits (GIANT) Consortium, and Early Growth Genetics (EGG) Consortium. A novel common variant in DCST2 is associated with length in early life and height in adulthood. Hum Mol Genet. 2015; 24:1155–68. https://doi.org/10.1093/hmg/ddu510 [PubMed]
- 45. Au Yeung SL, Lin SL, Li AM, Schooling CM. Birth weight and risk of ischemic heart disease: a mendelian randomization study. Sci Rep. 2016; 6:38420. https://doi.org/10.1038/srep38420 [PubMed]
- 46. Lillis AP, Van Duyn LB, Murphy-Ullrich JE, Strickland DK. LDL receptor-related protein 1: unique tissue-specific functions revealed by selective gene knockout studies. Physiol Rev. 2008; 88:887–918. https://doi.org/10.1152/physrev.00033.2007 [PubMed]
- 47. Mueller PA, Zhu L, Tavori H, Huynh K, Giunzioni I, Stafford JM, Linton MF, Fazio S. Deletion of macrophage low-density lipoprotein receptor-related protein 1 (LRP1) accelerates atherosclerosis regression and increases C-C chemokine receptor type 7 (CCR7) expression in plaque macrophages. Circulation. 2018; 138:1850–63. https://doi.org/10.1161/CIRCULATIONAHA.117.031702 [PubMed]
- 48. Boucher P, Gotthardt M, Li WP, Anderson RG, Herz J. LRP: role in vascular wall integrity and protection from atherosclerosis. Science. 2003; 300:329–32. https://doi.org/10.1126/science.1082095 [PubMed]
- 49. Mao H, Lockyer P, Li L, Ballantyne CM, Patterson C, Xie L, Pi X. Endothelial LRP1 regulates metabolic responses by acting as a co-activator of PPARγ. Nat Commun. 2017; 8:14960. https://doi.org/10.1038/ncomms14960 [PubMed]
- 50. Chatterjee M, Rath D, Schlotterbeck J, Rheinlaender J, Walker-Allgaier B, Alnaggar N, Zdanyte M, Müller I, Borst O, Geisler T, Schäffer TE, Lämmerhofer M, Gawaz M. Regulation of oxidized platelet lipidome: implications for coronary artery disease. Eur Heart J. 2017; 38:1993–2005. https://doi.org/10.1093/eurheartj/ehx146 [PubMed]
- 51. Hellmuth C, Lindsay KL, Uhl O, Buss C, Wadhwa PD, Koletzko B, Entringer S. Association of maternal prepregnancy BMI with metabolomic profile across gestation. Int J Obes (Lond). 2017; 41:159–69. https://doi.org/10.1038/ijo.2016.153 [PubMed]
- 52. Ikram MK, Sim X, Jensen RA, Cotch MF, Hewitt AW, Ikram MA, Wang JJ, Klein R, Klein BE, Breteler MM, Cheung N, Liew G, Mitchell P, et al, and Global BPgen Consortium. Four novel loci (19q13, 6q24, 12q24, and 5q14) influence the microcirculation in vivo. PLoS Genet. 2010; 6:e1001184. https://doi.org/10.1371/journal.pgen.1001184 [PubMed]
- 53. Ciosk R, DePalma M, Priess JR. ATX-2, the C. Elegans ortholog of ataxin 2, functions in translational regulation in the germline. Development. 2004; 131:4831–41. https://doi.org/10.1242/dev.01352 [PubMed]
- 54. Lastres-Becker I, Brodesser S, Lütjohann D, Azizov M, Buchmann J, Hintermann E, Sandhoff K, Schürmann A, Nowock J, Auburger G. Insulin receptor and lipid metabolism pathology in ataxin-2 knock-out mice. Hum Mol Genet. 2008; 17:1465–81. https://doi.org/10.1093/hmg/ddn035 [PubMed]
- 55. Kiehl TR, Nechiporuk A, Figueroa KP, Keating MT, Huynh DP, Pulst SM. Generation and characterization of Sca2 (ataxin-2) knockout mice. Biochem Biophys Res Commun. 2006; 339:17–24. https://doi.org/10.1016/j.bbrc.2005.10.186 [PubMed]
- 56. Shin SY, Fauman EB, Petersen AK, Krumsiek J, Santos R, Huang J, Arnold M, Erte I, Forgetta V, Yang TP, Walter K, Menni C, Chen L, et al, and Multiple Tissue Human Expression Resource (MuTHER) Consortium. An atlas of genetic influences on human blood metabolites. Nat Genet. 2014; 46:543–50. https://doi.org/10.1038/ng.2982 [PubMed]
- 57. Wang Q, Zhang M, Ding Y, Wang Q, Zhang W, Song P, Zou MH. Activation of NAD(P)H oxidase by tryptophan-derived 3-hydroxykynurenine accelerates endothelial apoptosis and dysfunction in vivo. Circ Res. 2014; 114:480–92. https://doi.org/10.1161/CIRCRESAHA.114.302113 [PubMed]
- 58. Niinisalo P, Oksala N, Levula M, Pelto-Huikko M, Järvinen O, Salenius JP, Kytömäki L, Soini JT, Kähönen M, Laaksonen R, Hurme M, Lehtimäki T. Activation of indoleamine 2,3-dioxygenase-induced tryptophan degradation in advanced atherosclerotic plaques: tampere vascular study. Ann Med. 2010; 42:55–63. https://doi.org/10.3109/07853890903321559 [PubMed]
- 59. Yun TJ, Lee JS, Machmach K, Shim D, Choi J, Wi YJ, Jang HS, Jung IH, Kim K, Yoon WK, Miah MA, Li B, Chang J, et al. Indoleamine 2,3-Dioxygenase-Expressing Aortic Plasmacytoid Dendritic Cells Protect against Atherosclerosis by Induction of Regulatory T Cells. Cell Metab. 2016; 24:886. https://doi.org/10.1016/j.cmet.2016.11.008 [PubMed]
- 60. Wang Y, Liu H, McKenzie G, Witting PK, Stasch JP, Hahn M, Changsirivathanathamrong D, Wu BJ, Ball HJ, Thomas SR, Kapoor V, Celermajer DS, Mellor AL, et al. Kynurenine is an endothelium-derived relaxing factor produced during inflammation. Nat Med. 2010; 16:279–85. https://doi.org/10.1038/nm.2092 [PubMed]
- 61. Favennec M, Hennart B, Caiazzo R, Leloire A, Yengo L, Verbanck M, Arredouani A, Marre M, Pigeyre M, Bessede A, Guillemin GJ, Chinetti G, Staels B, et al. The kynurenine pathway is activated in human obesity and shifted toward kynurenine monooxygenase activation. Obesity (Silver Spring). 2015; 23:2066–74. https://doi.org/10.1002/oby.21199 [PubMed]
- 62. Wolowczuk I, Hennart B, Leloire A, Bessede A, Soichot M, Taront S, Caiazzo R, Raverdy V, Pigeyre M, Guillemin GJ, Allorge D, Pattou F, Froguel P, Poulain-Godefroy O, and ABOS Consortium. Tryptophan metabolism activation by indoleamine 2,3-dioxygenase in adipose tissue of obese women: an attempt to maintain immune homeostasis and vascular tone. Am J Physiol Regul Integr Comp Physiol. 2012; 303:R135–43. https://doi.org/10.1152/ajpregu.00373.2011 [PubMed]
- 63. Wang KC, Lim CH, McMillen IC, Duffield JA, Brooks DA, Morrison JL. Alteration of cardiac glucose metabolism in association to low birth weight: experimental evidence in lambs with left ventricular hypertrophy. Metabolism. 2013; 62:1662–72. https://doi.org/10.1016/j.metabol.2013.06.013 [PubMed]
- 64. Yao C, Chen G, Song C, Keefe J, Mendelson M, Huan T, Sun BB, Laser A, Maranville JC, Wu H, Ho JE, Courchesne P, Lyass A, et al. Genome-wide mapping of plasma protein QTLs identifies putatively causal genes and pathways for cardiovascular disease. Nat Commun. 2018; 9:3268. https://doi.org/10.1038/s41467-018-05512-x [PubMed]
- 65. Nielson C, Lange T, Hadjokas N. Blood glucose and coronary artery disease in nondiabetic patients. Diabetes Care. 2006; 29:998–1001. https://doi.org/10.2337/diacare.295998 [PubMed]
- 66. Karalis DG, Victor B, Ahedor L, Liu L. Use of lipid-lowering medications and the likelihood of achieving optimal LDL-cholesterol goals in coronary artery disease patients. Cholesterol. 2012; 2012:861924. https://doi.org/10.1155/2012/861924 [PubMed]
- 67. Autism Spectrum Disorders Working Group of The Psychiatric Genomics Consortium. Meta-analysis of GWAS of over 16,000 individuals with autism spectrum disorder highlights a novel locus at 10q24.32 and a significant overlap with schizophrenia. Mol Autism. 2017; 8:21. https://doi.org/10.1186/s13229-017-0137-9 [PubMed]
- 68. Purcell S, Neale B, Todd-Brown K, Thomas L, Ferreira MA, Bender D, Maller J, Sklar P, de Bakker PI, Daly MJ, Sham PC. PLINK: a tool set for whole-genome association and population-based linkage analyses. Am J Hum Genet. 2007; 81:559–75. https://doi.org/10.1086/519795 [PubMed]
- 69. Benjamini Y, Drai D, Elmer G, Kafkafi N, Golani I. Controlling the false discovery rate in behavior genetics research. Behav Brain Res. 2001; 125:279–84. https://doi.org/10.1016/s0166-4328(01)00297-2 [PubMed]
- 70. Hemani G, Zheng J, Elsworth B, Wade KH, Haberland V, Baird D, Laurin C, Burgess S, Bowden J, Langdon R, Tan VY, Yarmolinsky J, Shihab HA, et al. The MR-base platform supports systematic causal inference across the human phenome. Elife. 2018; 7:e34408. https://doi.org/10.7554/eLife.34408 [PubMed]
- 71. Zhang Q, Greenbaum J, Zhang WD, Sun CQ, Deng HW. Age at menarche and osteoporosis: a mendelian randomization study. Bone. 2018; 117:91–97. https://doi.org/10.1016/j.bone.2018.09.015 [PubMed]
- 72. Hartwig FP, Davies NM, Hemani G, Davey Smith G. Two-sample mendelian randomization: avoiding the downsides of a powerful, widely applicable but potentially fallible technique. Int J Epidemiol. 2016; 45:1717–26. https://doi.org/10.1093/ije/dyx028 [PubMed]
- 73. Bonder MJ, Luijk R, Zhernakova DV, Moed M, Deelen P, Vermaat M, van Iterson M, van Dijk F, van Galen M, Bot J, Slieker RC, Jhamai PM, Verbiest M, et al, and BIOS Consortium. Disease variants alter transcription factor levels and methylation of their binding sites. Nat Genet. 2017; 49:131–38. https://doi.org/10.1038/ng.3721 [PubMed]
- 74. Zheng Q, Wang XJ. GOEAST: a web-based software toolkit for gene ontology enrichment analysis. Nucleic Acids Res. 2008; 36:W358–63. https://doi.org/10.1093/nar/gkn276 [PubMed]
- 75. Szklarczyk D, Gable AL, Lyon D, Junge A, Wyder S, Huerta-Cepas J, Simonovic M, Doncheva NT, Morris JH, Bork P, Jensen LJ, Mering CV. STRING v11: protein-protein association networks with increased coverage, supporting functional discovery in genome-wide experimental datasets. Nucleic Acids Res. 2019; 47:D607–13. https://doi.org/10.1093/nar/gky1131 [PubMed]