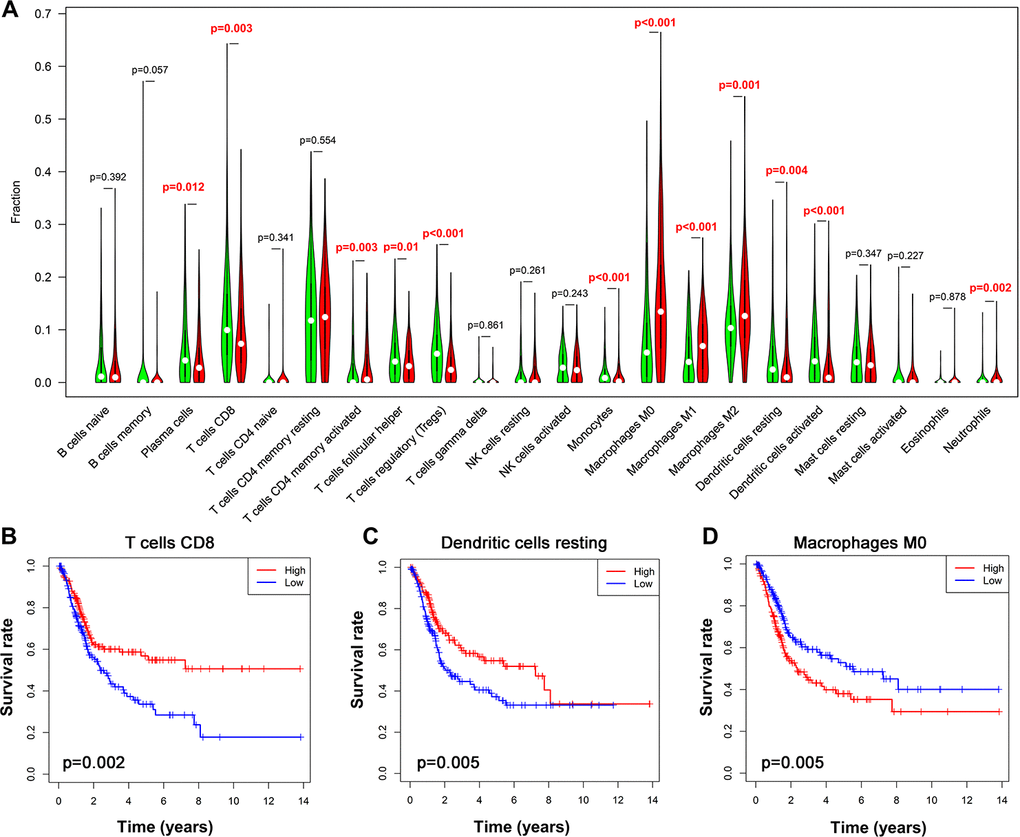
Figure 9.Alteration of immune cell infiltration in BLCA samples with different risk status. (A) Violin plot demonstrating the TILCs associated with the risk model. High- and low-risk groups are represented by red and green violin, respectively. (B–D) Kaplan-Meier curve analysis of overall survival for various immune cells infiltration. (B) CD8 T cells; (C) dendritic cells resting; (D) macrophages M0.