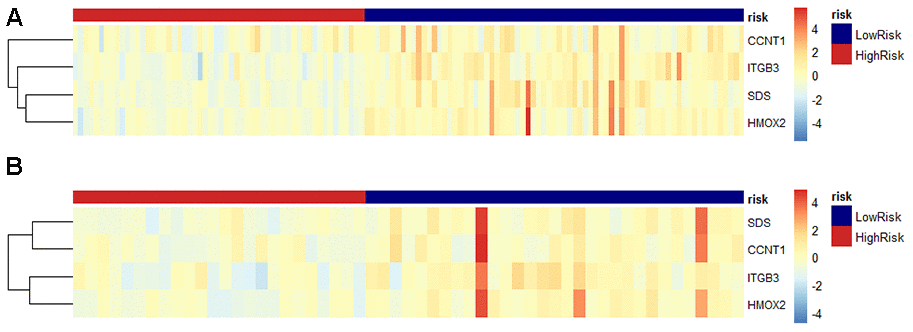
Figure 2.Predicted DNA methylation marker heat map of PDAC patients based on risk scores tested in the training cohort and validation cohort. (A) In the training data set, the relative gene expression level of the four DNA methylation genes in the prediction model based on the risk score is displayed in the form of a heat map. Each column represents a single patient in the combined verification cohort, ranked according to the predictor score, with the lowest score. Each row represents a gene in the model, sorted by gene's contribution to the score. Blue represents low risk, red represents high risk. (B) Same as above, perform the same operation in the verification data set for verification.