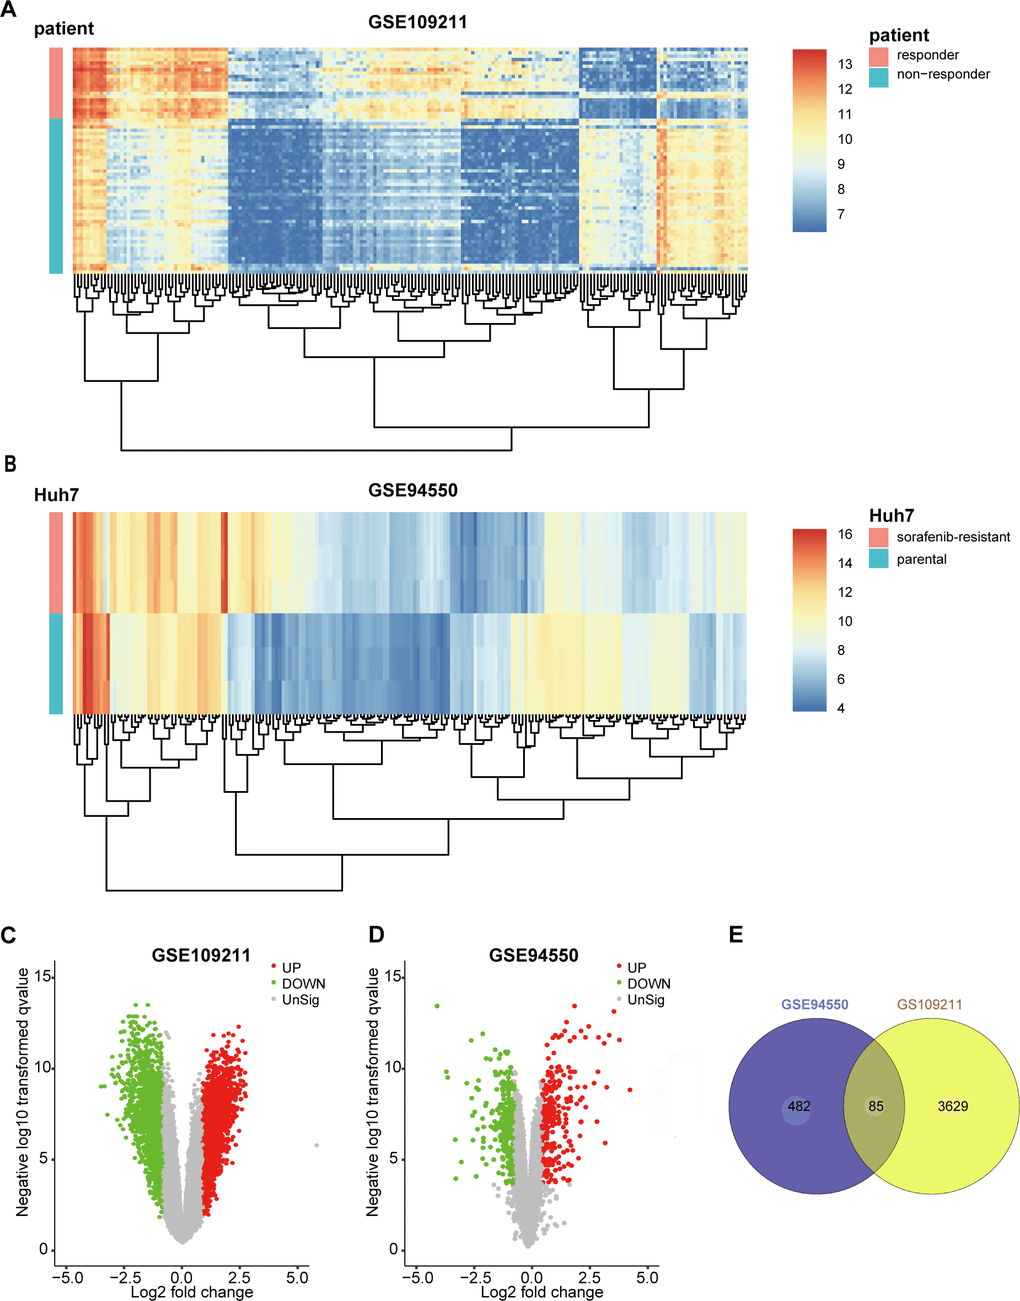
Figure 1.Identification of DEGs in sorafenib-treated HCC. To screen the genes associated with resistance or response of sorafenib (|log2FoldChange| ≥1 and FDR <0.05), 3714 DEGs between responder and non-responder were identified following the selection criteria, while 567 DEGs between untreated parental Huh7 cells (n=3) and sorafenib-resistant pool cells (n=3) in GSE94550. The DEGs were visualized with Heatmaps and volcano plots. (A) Heatmap plot of the top 200 DEGs of GSE109211. (B) Heatmap plot of the top 200 DEGs of GSE94550. (C, D) Volcano plot of the DEGs of GSE109211 and GSE94550, in which red stands for upregulations, green stands for downregulations, and black stands for normal expression. Each point represents a gene. (E) The overlap unified among the 2 datasets contained 85 DEGs was shown by Venn diagram. DEGs, differentially expressed genes.