


Introduction
Hepatocellular carcinoma (HCC) is among the most lethal malignancies, with high morbidity and mortality worldwide. HCC is the second leading cause of cancer-related deaths globally, with only a 5-year survival rate of ~10% and resulting in 700,000 deaths annually [1]. The main risk factors for HCC are hepatitis B or C infection, alcoholism, diabetes, autoimmune hepatitis, and possibly several metabolic diseases. In developed countries, there has been an increase in HCC incidence, partly attributed to obesity and diabetes [2, 3].
Treatment strategies for HCC, including radiofrequency ablation, liver transplantation, or resection, might be curative only when diagnosed early. However, most patients are relatively asymptomatic during early stages, and due to the rapid progression of the disease, 80% of HCC patients are diagnosed at advanced stages. Less than 30% of patients with HCC can be managed by curative therapy, and sorafenib, a multi-target kinase inhibitor, has been approved in a number of randomized controlled trials (RCTs) for first-line treatment in patients with advanced liver cancer to improve overall survival [4, 5]. Sorafenib can block tumor cell proliferation by promoting apoptosis and suppressing anti-apoptotic and metastatic activity; however, the response rate to sorafenib is low, and many patients develop drug resistance and serious adverse side effects. Initiation and development of sorafenib resistance (SR) is considered a multi-step process, although the precise molecular events that underlie resistance remain only partially understood. This highlights the need for continued development of biomarkers allowing determination of which patients are more likely to benefit from sorafenib and a better understanding of the molecular mechanisms involved.
Novel treatments are under intense exploration. Combination with traditional treatment or other drugs has potential clinical utility [6–8]. Histone deacetylase is one of the potential therapeutic targets [9]. Panostatin combined with sorafenib resulted in decreased tumor volume and increased survival in a murine xenograft model [10]. Tegafur/uracil can be used in combination with sorafenib in patients with advanced liver cancer, which can improve the efficacy of sorafenib while showing safety [11]. Recently, immunotherapy based on immune checkpoint inhibitors (ICIs) has delivered unprecedented success. ICIs targeting the programed cell death protein 1/programmed death ligand-1 (PD-L1) pathway demonstrated clinical activity in HCC, whereas many other ICIs are in clinical development [12]. The role of the tumor microenvironment (TME) has received increased attention across a number of cancers in recent years; however, to date, there remains a paucity of discussion concerning cellular characterization of immune infiltrates and relationship between TME and SR in HCC patients treated with sorafenib.
Here, we conducted a comprehensive and integrative analysis, as well as experimental validation, to identify biomarkers predicting SR in HCC and factors independently associated with prognosis. Two microarray datasets from the Gene Expression Omnibus (GEO) were analyzed using a series of bioinformatics tools and another independent dataset from The Cancer Genome Atlas (TCGA) as the validation series. This study provides predictive biomarkers and potential therapeutic targets for SR in HCC patients and might contribute to the development of precision therapy for HCC.
Results
Identification of DEGs
The GSE109211 dataset contained 140 samples from HCC patients, of whom 67 were treated with sorafenib and 73 with Plac. The sorafenib group was divided into “responder” (n = 21) and “non-responder” (n = 46) groups in terms of RFS. Compared with the responder group, sorafenib non-responders were defined as patients in whom sorafenib had no effect (those not reaching the median RFS) [13]. To screen genes associated with resistance or response to sorafenib (|log2FoldChange| ≥ 1 and false discovery rate < 0.05), 3,714 DEGs between responders and non-responders were identified according to the selection criteria, whereas 567 DEGs were identified between untreated parental Huh7 cells (n = 3) and SR pool cells (n = 3) in GSE94550. The top 200 DEGs from GSE109211 and GSE94550 are shown in the heatmap (Figure 1A, 1B), with DEGs visualized by volcano plot (Figure 1C, 1D). The overlap of the two datasets included 85 genes (Figure 1E).
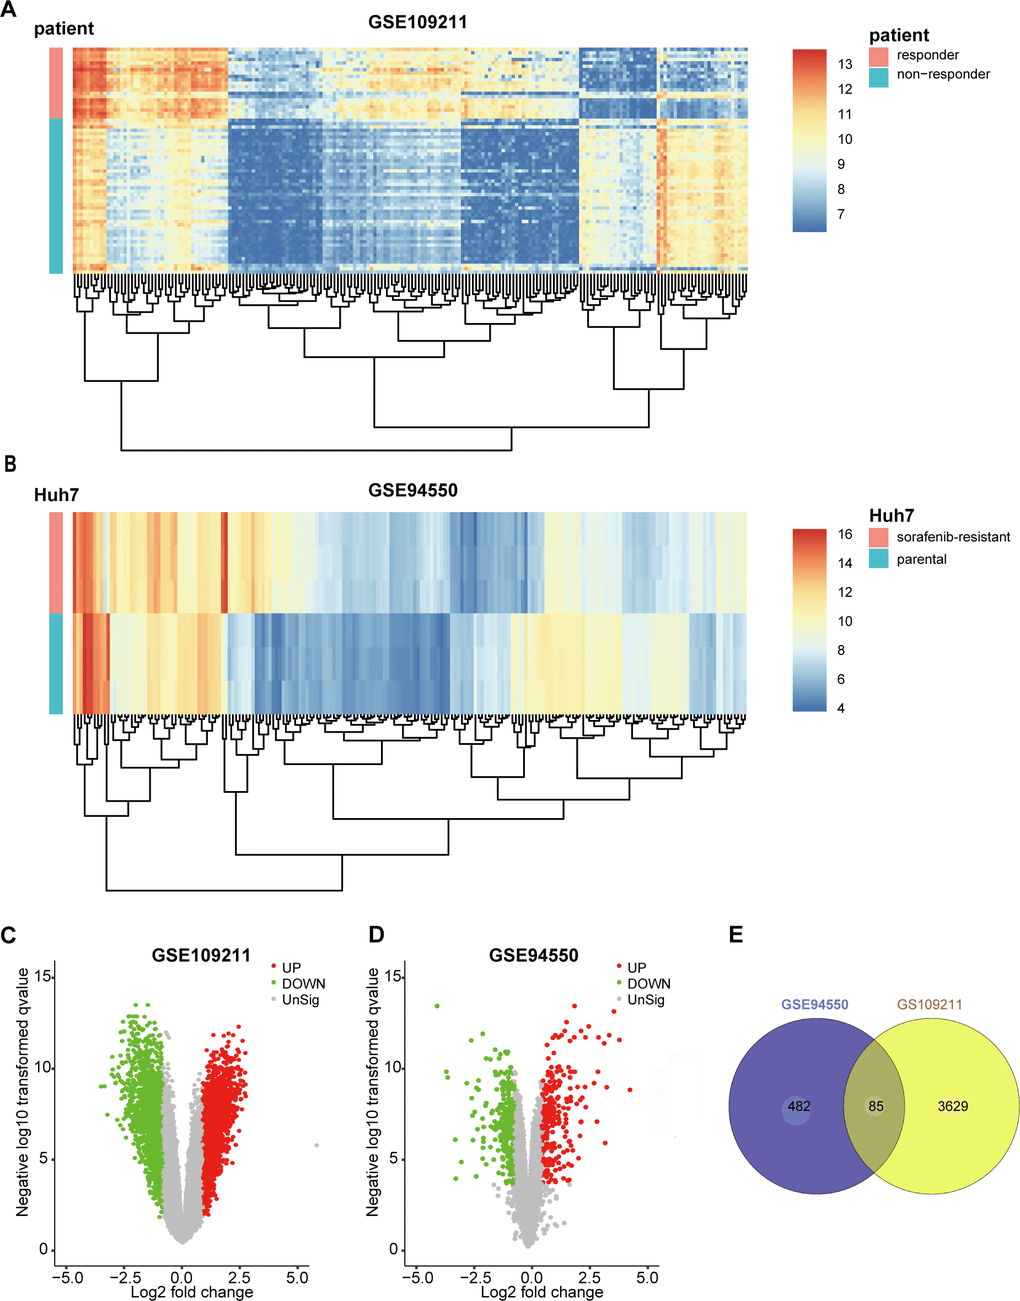
Figure 1. Identification of DEGs in sorafenib-treated HCC. To screen the genes associated with resistance or response of sorafenib (|log2FoldChange| ≥1 and FDR <0.05), 3714 DEGs between responder and non-responder were identified following the selection criteria, while 567 DEGs between untreated parental Huh7 cells (n=3) and sorafenib-resistant pool cells (n=3) in GSE94550. The DEGs were visualized with Heatmaps and volcano plots. (A) Heatmap plot of the top 200 DEGs of GSE109211. (B) Heatmap plot of the top 200 DEGs of GSE94550. (C, D) Volcano plot of the DEGs of GSE109211 and GSE94550, in which red stands for upregulations, green stands for downregulations, and black stands for normal expression. Each point represents a gene. (E) The overlap unified among the 2 datasets contained 85 DEGs was shown by Venn diagram. DEGs, differentially expressed genes.
Functional enrichment analysis of the DEGs
To explore the potential function(s) of the DEGs, GO and KEGG enrichment analyses were performed. We detected enrichment in several biological process GO terms, such as extracellular structure organization, posttranslational protein modification, and negative regulation of proteolysis (Figure 2A). Regarding molecular function, enzyme inhibitor activity was the most significant (Figure 2B). Furthermore, several cellular components GO terms, such collagen-containing extracellular matrix, blood microparticle, and endoplasmic reticulum lumen, were enriched (Figure 2C). KEGG pathway analysis revealed that complement and coagulation cascades, cholesterol metabolism, and peroxisomes were mostly associated with the DEGs (Figure 2D). To further explore the relationship between these terms, genes were layered into a tree based on Kappa-statistical similarities among their gene members, with terms having a similarity >0.3 connected by edges (Figure 2E).
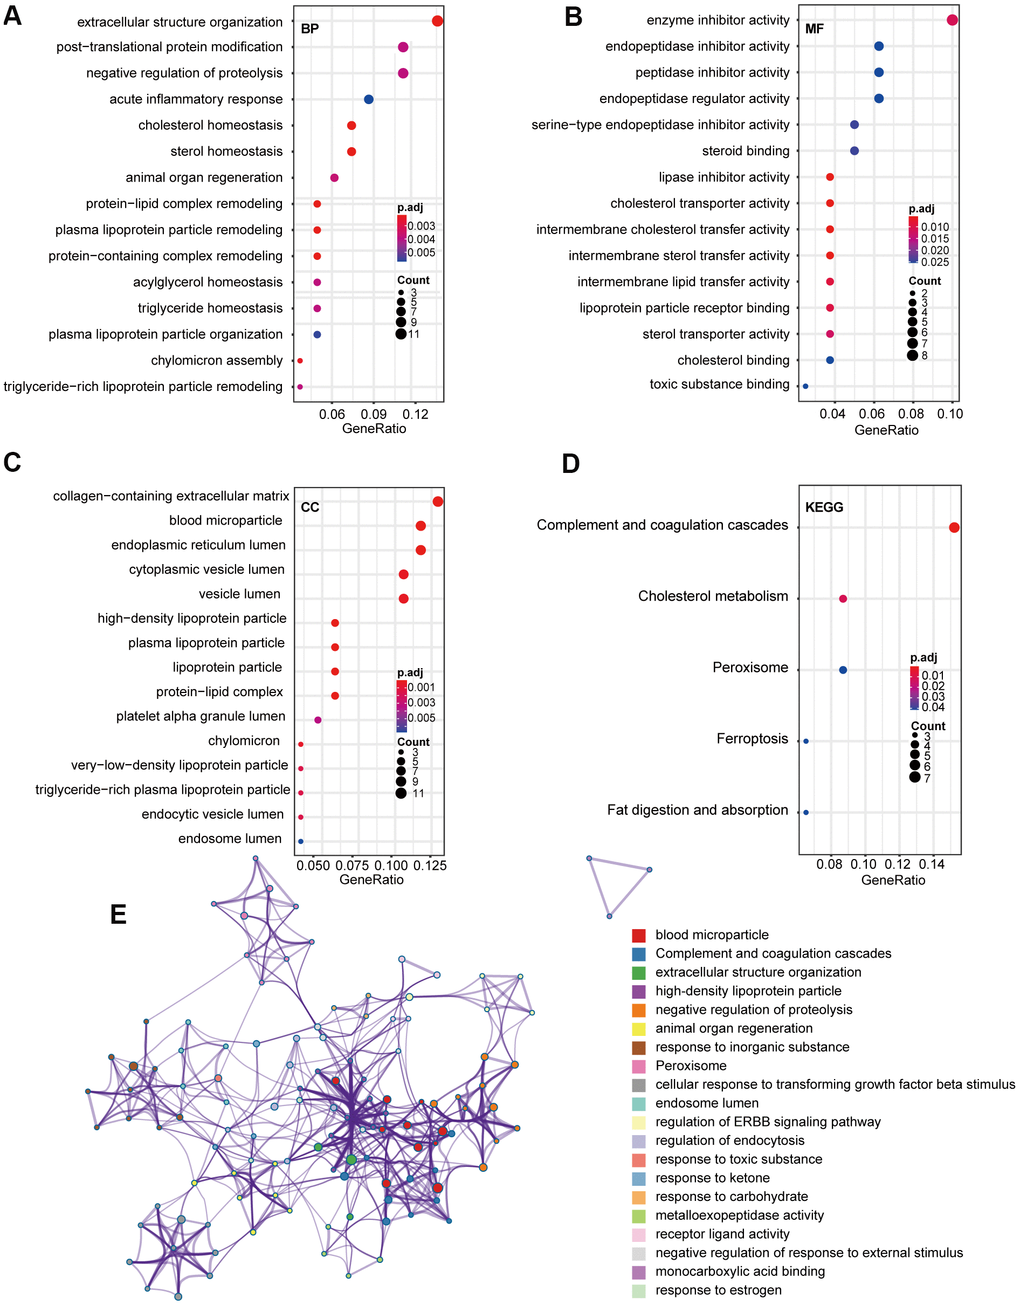
Figure 2. GO and KEGG pathway analysis of 85 overlap DEGs. (A) Biological process GO terms for DEGs. (B) Molecular function GO terms for DEGs. (C) Cellular component GO terms for DEGs. (D) KEGG analysis for DEGs. (E) Enriched Ontology Clusters of statistically enriched terms. Each term is represented by a circle node, where its size is proportional to the number of input genes that fall into that term, and its color represents its cluster identity. The y-axis represents the pathways and the x-axis represents enriched gene numbers, and the color means adjust P-value. The netplot of KEGG pathways means the enrichment of genes in different pathways. And the number adjacent to nodes stands for gene ID. GO, Gene Ontology; BP, biological process; MF, molecular function; CC, cellular component; KEGG, Kyoto Encyclopedia of Genes and Genomes; DEGs, differentially expressed genes.
Screening of hub genes
A PPI network for the DEGs was constructed by STRING (Figure 3A), with interactions with a combined score >0.4 considered statistically significant. Node pairs were uploaded to Cytoscape and analyzed using MCODE, resulting in 23 hub genes selected from the network according to the following criteria: MCODE score, >5; degree, >2; node score, >0.2; node density, >0.1; and k-score, 2 (Figure 3B).
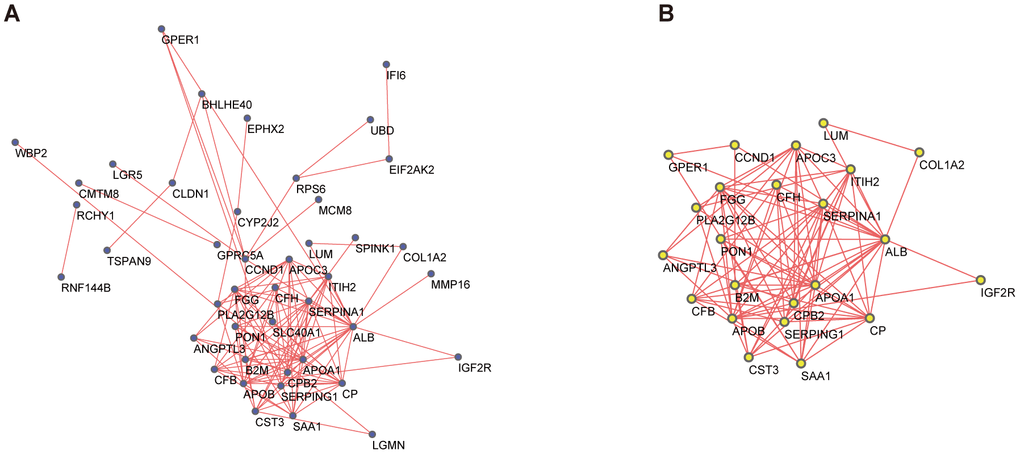
Figure 3. PPI network and the most significant module of DEGs. (A) The PPI network of DEGs was constructed based on database STRING and Cytoscape software. (B) The most significant module was obtained from the PPI network by MCODE with criteria as follows: MCODE scores > 5, degree cut-off = 2, node score cut-off= 0.2, node density cut-off=0.1, Max depth=100 and k-score = 2. PPI, protein-protein interaction; DEGs, differentially expressed genes; MCODE, Molecular Complex Detection (version 1.6), an APP of Cytoscape for clustering a given network based on the topology to find densely connected regions.
CeRNA network
Among the 3,714 DEGs identified between “responder” and “non-responder” groups in GSE109211, 43 DElncRNAs and 2,875 DEmRNAs were identified and annotated. TargetScan, MiRDB, and miRanda were used to predict potential miRNA targets for the DEmRNAs, resulting in formation of 293 of 2,875 DEmRNAs and 29 miRNAs into 370 miRNA–mRNA pairs (Figure 4A). We then used miRcode to identify lncRNA–mRNA pairs, resulting in formation of 27 of 43 DElncRNAs and 207 miRNAs into 1,612 lncRNA–miRNA pairs. We ultimately selected 10 miRNAs (Figure 4B) and finalized the ceRNA network with a total of 26 lncRNAs, 194 mRNAs, and 10 miRNAs (Figure 4C).
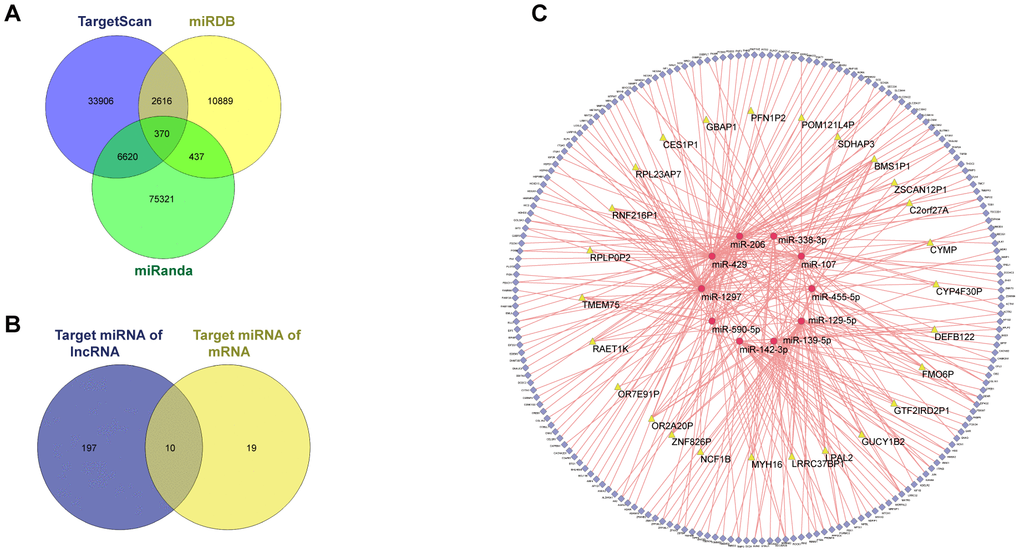
Figure 4. ceRNA network of GSE109211. Among the 3714, DEGs between the responder and non-responder in GSE109211, 43 DElncRNAs and 2875 DEmRNAs were identified. miRDB, miRanda, and TargetScan were used to predict the potential miRNA target by DEmRNAs. Only the miRNA-mRNA pairs that exist in all three databases were enrolled in the ceRNA network. The miRcode was applied to predict the potential miRNA target by DElncRNAs. As a result, a total of 26 lncRNAs, 194 mRNAs, and 10 miRNAs were enrolled in the ceRNA network. (A) Venn diagram of miRNA-mRNA pairs. (B) Venn diagram of target miRNAs. (C) CeRNA network of GSE109211. The yellow, red, and blue represent lncRNA, miRNA, and mRNA, respectively. Pink edges indicate lncRNA-miRNA-mRNA interactions. DEGs, differentially expressed genes; LncRNA, long non-coding RNA; miRNA, micro RNA; mRNA, messenger RNA; CeRNA, competing endogenous RNA.
Construction and validation of the lasso regression model
We divided 67 sorafenib-treated samples from GSE109211 into responder (n = 21) and non-responder (n = 46) sets according to RFS. To further screen genes associated with SR among the hub genes (mRNA) and the key lncRNAs, we constructed a risk score model of SR prediction using Lasso regression, with the penalty regularization parameter λ determined along with an n-fold value equal to 10 (Figure 5A, 5B). Fourteen genes were identified according to the minimum λ value, including seven mRNAs [complement factor B (CFB), collagen type I alpha 2 chain, cystatin C, G protein-coupled estrogen receptor 1, insulin-like growth factor 2 receptor (IGF2R), profilin 1 pseudogene 2, paraoxonase 1 (PON1)] and seven lncRNAs (BMS1P1, C2orf27A, CYP4F30P, DEFB122, OR2A20P, ZNF826P, and ZSCAN12P1). A Wilcoxon signed rank test performed to compare sorafenib non-responders with responders revealed a significant difference in polygenic risk scores (P = 6.9e−16) (Figure 5C), with the robustness and accuracy of this model indicated according to an AUC of 0.993 (Figure 5D). A heatmap showing the gene expression of selected genes from GSE109211 is shown in Figure 5E.
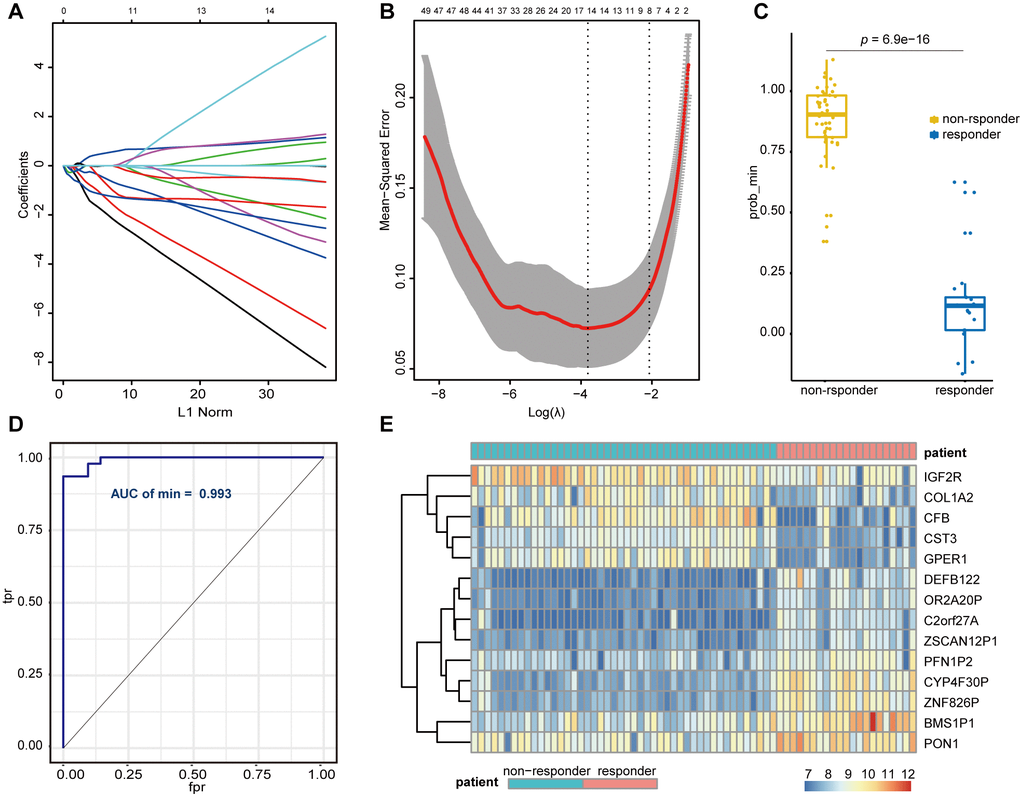
Figure 5. Lasso regression establishment and validation in GSE109211. (A) LASSO coefficient profiles of the genes associated with the sorafenib resistance in HCC patients. (B) The mean-squared error was plotted versus log (lambda). The two dashed lines indicate two special lambda values, one is lambda.min and the other is lambda.1se, and the lambda between the two values is considered appropriate. We finally chose lambda.min, because it’s the value of Lambda that gives a minimum mean cross-validated error. (C) Wilcoxon Signed Rank Test was performed to compare the sorafenib non-responder and responder. (D) ROC curves for the performance of the Lasso regression model in predicting sorafenib resistance in HCC patients. (E) Heatmap of differentially expressed genes that were enrolled in the Lasso regression model. LASSO, Least absolute shrinkage and selection operator; HCC, Hepatocellular Carcinoma; ROC, Receiver Operating Characteristic; tpr, true-positive rates; fpr, false-positive rates.
TCGA validation of the selected genes
To investigate candidate predictive biomarkers, we analyzed the selected genes against TCGA-LIHC data. Univariate Cox regression performed to screen prognostic factors based on Lasso regression (Supplementary Table 1) revealed four genes selected according to their correlation with overall survival (3 mRNAs and 1 lncRNA). To estimate their potential prognostic value and classification effect in HCC patients, their expression and subsequent protein levels were comprehensively evaluated using UALCAN and the Human Protein Atlas.
As shown in Figure 6, expression of C2orf27A and IGF2R in 20 HCC samples relative to normal tissues was significantly higher according to TCGA datasets (Figure 6A, 6B), whereas CFB and PON1 were significantly downregulated (Figure 6C, 6D). We then assessed protein levels associated with the three mRNAs in HCC cells using the Human Protein Atlas, finding results similar to those for mRNA levels (Figure 7), with elevated IGF2R levels in HCC tissues relative to normal tissues (Figure 7A) and lower CFB and PON1 levels observed in HCC tissues relative to normal tissues (Figure 7B, 7C). These results indicated that C2orf27A and IGF2R upregulated in HCC patients, whereas CFB and PON1 were significantly downregulated.
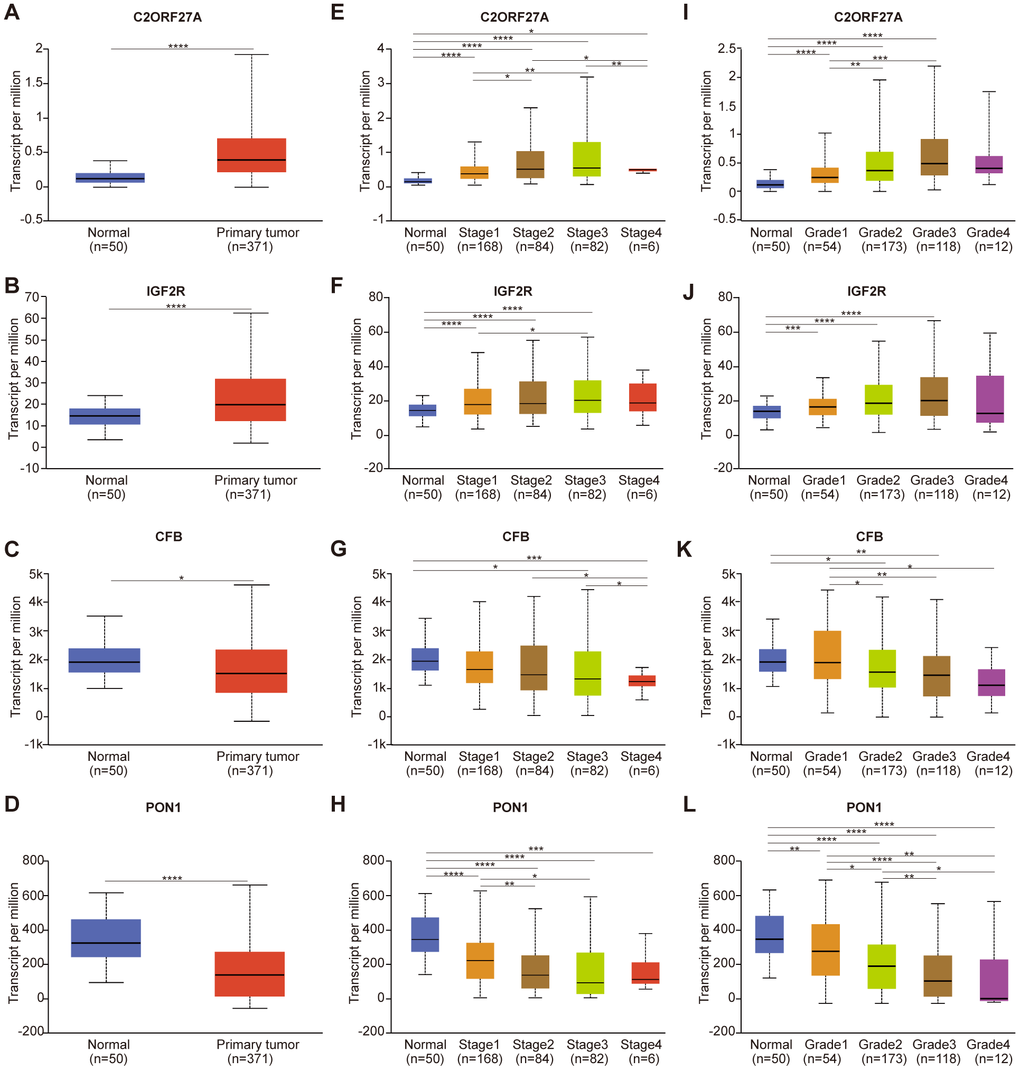
Figure 6. Relationship between the expression of candidate genes and clinicopathological parameters of HCC patients in TCGA (UALCAN). (A–D) Transcriptional expression of candidate genes in HCC tissues and adjacent normal liver tissues. (E–H) Transcriptional expression of candidate genes in different cancer stages of HCC patients. (I–L) Transcriptional expression of candidate genes in different tumor grades of HCC patients. HCC, Hepatocellular Carcinoma; *p<0.05, **p<0.01, ***p<0.001, ****p<0.0001.
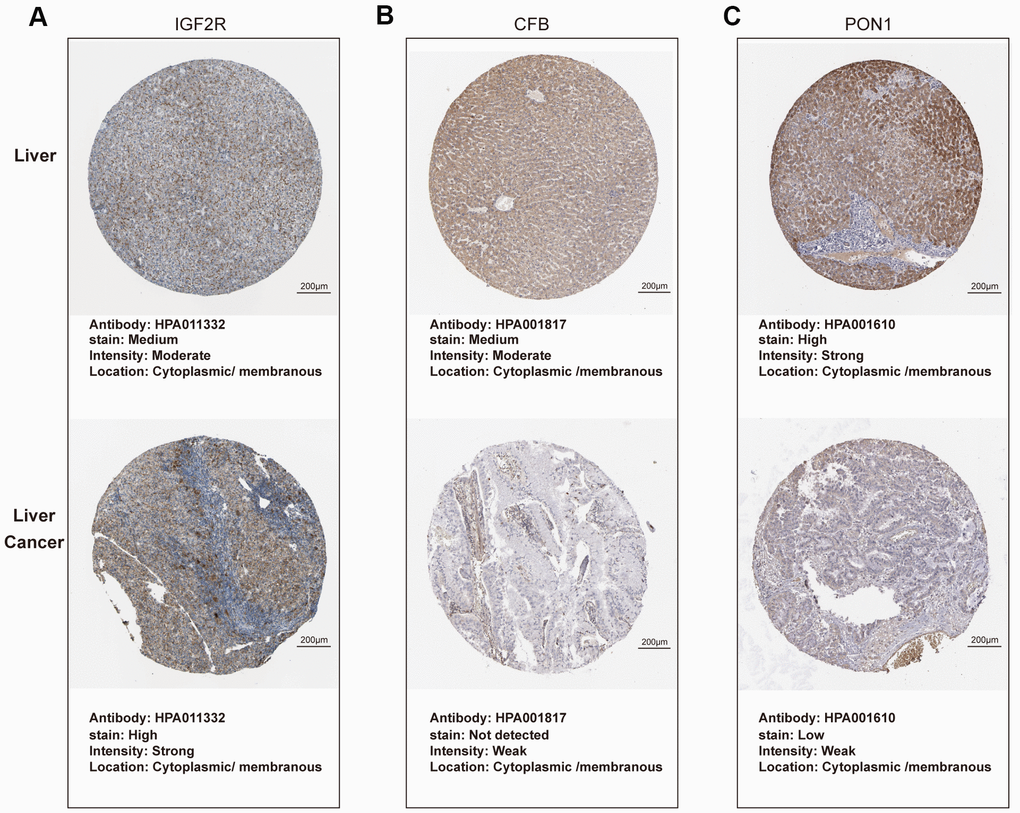
Figure 7. Protein expression of candidate genes in HCC tissues and normal liver tissues (Human Protein Atlas). (A–C) Representative immunohistochemistry images of IGF2R, CFB, PON1 in HCC tissues, and normal liver tissues, respectively.
We then analyzed relationships between gene expression, cancer stage, and tumor grade. As shown in Figure 6, expression of the four candidate genes was notably correlated with cancer stage and tumor grade, with expression of C2orf27A and IGF2R higher in patients with advanced cancer or higher tumor grade, whereas CFB and PON1 expression was lower. The highest expression of C2orf27A and IGF2R was found at stage 3 (Figure 6E, 6F), and the lowest expression of CFB and PON1 was observed at stages 3 and 4 (Figure 6G, 6H), although the reason for higher expression at stage 3 relative to stage 4 might be the small sample size (there were only 6 patients with stage 4 HCC). Similarly, the highest expression of C2orf27A and IGF2R was found at tumor grade 3 (Figure 6I, 6J), and the lowest expression of CFB and PON1 was found at grade 4 (Figure 6K, 6L). These results identified an association between the expression of four candidate genes with clinicopathological parameters in HCC patients, suggesting their possible involvement in HCC carcinogenesis or progression.
Prognostic value of the selected genes in liver cancer
We assessed the prognostic value of the four genes in liver cancer using Kaplan–Meier analysis. Figure 8 shows the Kaplan–Meier curve and the results of log-rank analyses, revealing that elevated expression of C2orf27A and IGF2R negatively impacted the 5-year survival rate [hazard ration (HR) =1.68 and 1.48, 95% confidence interval (CI): 1.16–2.43 and 1.03–2.11; p = 0.0056 and p = 0.031, respectively] and 3-year survival rate (HR = 1.86 and 1.75, 95% CI: 1.26–2.75 and 1.19–2.58; and p = 0.0017 and p = 0.041, respectively). Similarly, elevated expression of CFB and PON1 showed positive effects on 5-year survival (HR = 0.55 and 0.4, 95% CI: 0.38–0.79 and 0.28–0.58; p = 0.00087 and p = 3.6e−07, respectively) (Figure 8A, 8B, 8E, 8F) and 3-year survival rates (HR = 0.47 and 0.36, 95% CI: 0.32–0.7 and 0.24–0.53; p = 0.00012 and p = 9.4e−08, respectively) (Figure 8C, 8D, 8G, 8H). These results indicated that the expression of C2orf27A, IGF2R, CFB, and PON1 were significantly associated with liver cancer prognosis.
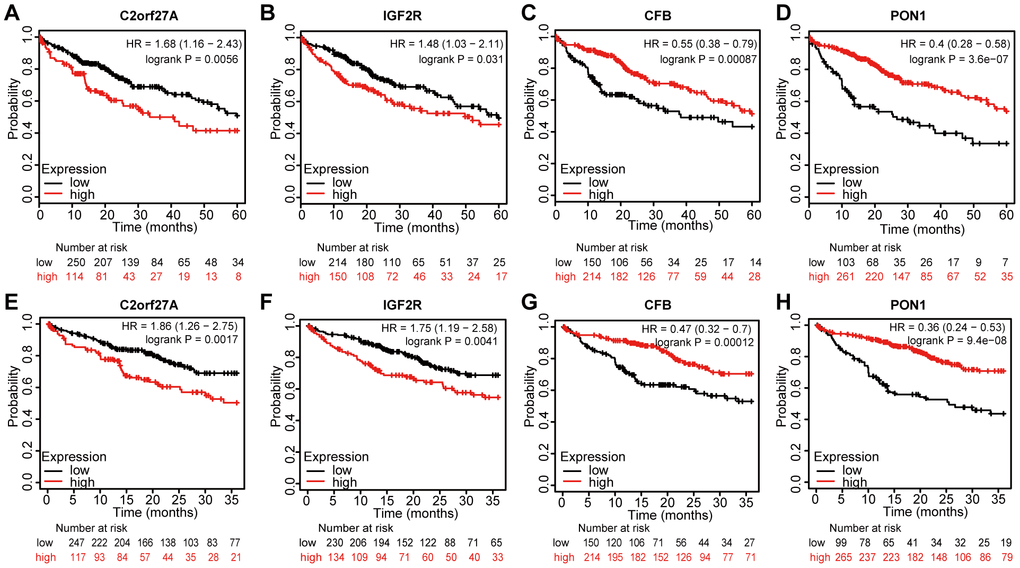
Figure 8. Prognostic value of selected genes in liver cancer patients (Kaplan-Meier Plotter). (A, B, E, F) Kaplan–Meier survival curves comparing the samples with high expression of the four selected genes with those with low expression in liver cancer conducted within 5 years by using Kaplan–Meier plotter. (C, D, G, H) Kaplan–Meier survival curves conducted comparing the samples with high expression of the four selected genes with those with low expression in liver cancer conducted within 3 years by using Kaplan–Meier plotter. HR, hazard ratio.
Effect of selected genes on the cytotoxicity of sorafenib
To determine whether selected genes were involved in tumorigenesis and development of HCC under sorafenib treatment, we first detected gene expression in liver cell line LO2 and HCC cell line Huh7. As shown in Figure 9A, the expression of C2orf27A and IGF2R was significantly upregulated in Huh7 cells compared to LO2, and the lower expression of CFB and PON1 was observed in Huh7 cells. We then detected the effects of sorafenib on Huh7 cell proliferation and invasion after RNA interference. Four selected genes were knocked down by transfection with siRNA or lncRNA smart silencer, which were shown in Supplementary Figure 1. The treated Huh7 cells were exposed to sorafenib, and cell proliferation and invasion were detected 48 hours later. As a result, cell proliferation and invasion increased significantly after RNA interference of CFB and PON1, while significant mitigation was observed after knockdown of C2orf27A and IGF2R (Figure 9B, 9C), suggesting their possible regulation on the cytotoxicity of sorafenib.
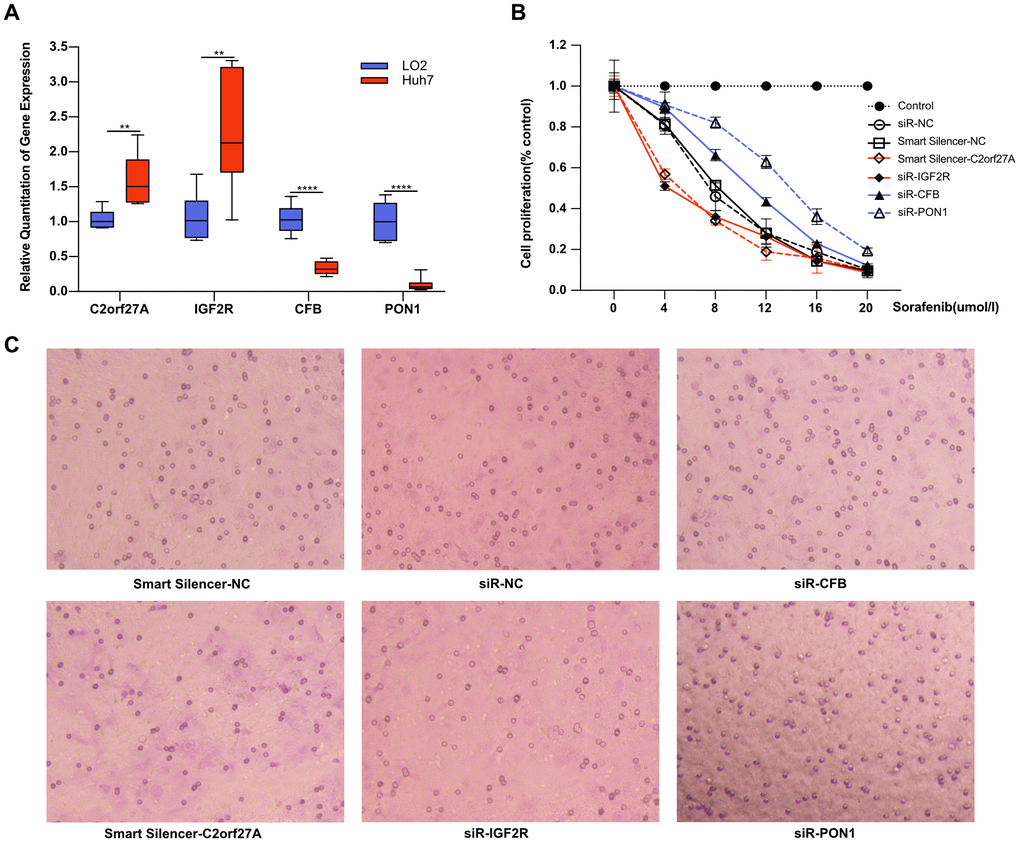
Figure 9. Effect of selected genes on the cytotoxicity of sorafenib. Experimental verification of the relationship between the selected genes and sorafenib resistance in vitro. (A) Transcriptional expression of four selected genes in Huh7 cells compared to LO2. With transfection with siRNA or lncRNA smart silencer, the treated Huh7 cells were exposed to sorafenib, and cell proliferation and invasion were detected 48 hours later. (B, C) The effects of sorafenib on Huh7 proliferation and invasion after RNA interference. **p<0.01, ****p<0.0001.
TME analysis
We then evaluated the cellular characterization of immune infiltrates in sorafenib-treated patients with HCC. Using an ssGSEA strategy, we estimated 28 immune cell types in the TME, including major types related to adaptive and innate immunity (Figure 10A). To investigate differences in immunophenotypes associated with clinical characteristics of the tumors, variation analysis of the normalized enrichment scores was used to identify SR-associated cell types. As shown in Figure 10A, most tumor-infiltrating lymphocytes (21/28) were associated with SR.
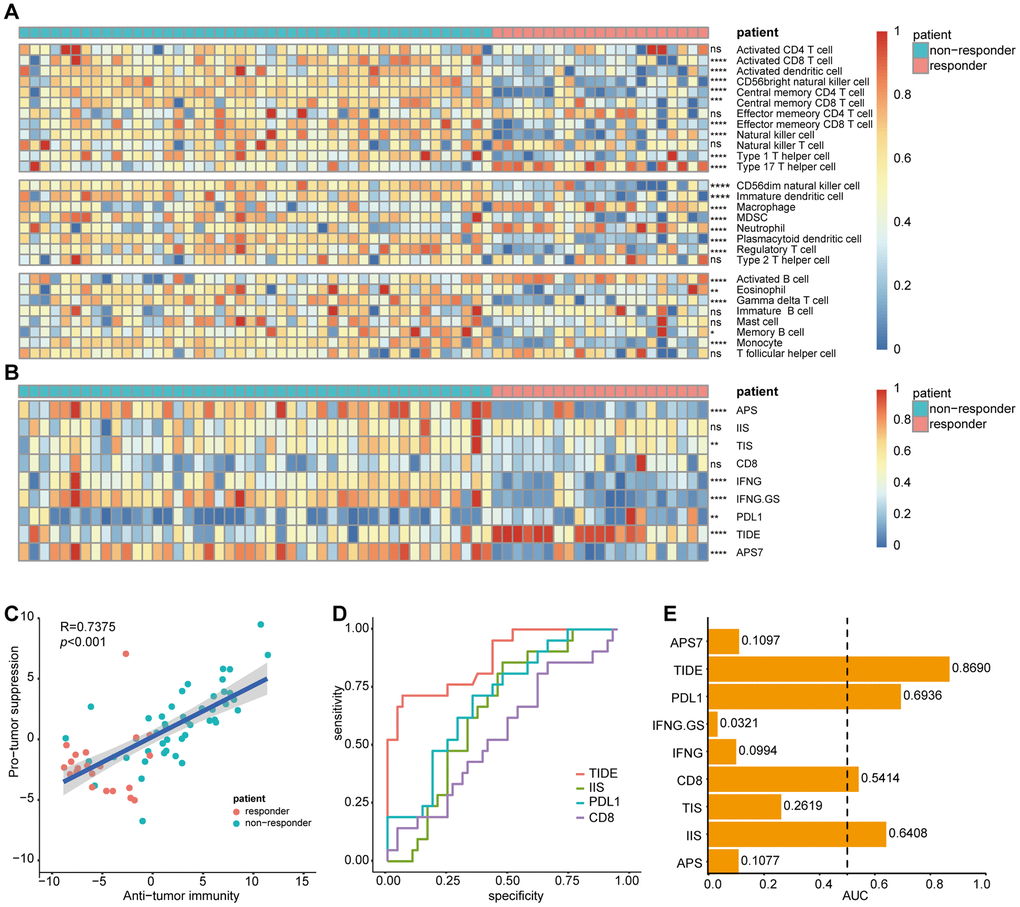
Figure 10. Correlation of sorafenib resistance and immune cell infiltration heterogeneity. Single-sample gene set enrichment analysis identifying the relative infiltration of immune cell populations for 67 HCC samples treated with sorafenib in GSE109211. The relative infiltration of each cell type is normalized into a z-score. Biomarkers can predict immunotherapy response were calculated and normalized with GSVA, including APS, IIS, TIS, CD8, IFNG, IFNG.GS, PDL1, TIDE, and APS7. (A, B) Heatmap of immune cell z-scores and immune infiltration scores. P values describe differences between the responder and non-responder. (C) Pearson's correlation between infiltration of cell types executing anti-tumor reactivity (ActCD4, ActCD8, ActDC, TcmCD4, TcmCD8, TemCD4, TemCD8, NKT, NK, CD56brightNK, Th1 and Th17 cells) and cell types delivering pro-tumor suppression (CD56dimNK, imDC, TAM, MDSC, Neutrophil, pDC, Treg, and Th2 cells). The shaded area represents 95% confidence interval. (D) AUC of immune infiltration scores. (E) ROC curves for the performance of immune infiltration scores in predicting sorafenib resistance in HCC patients. Only biomarkers with AUC greater than 0.5 were displayed. HCC, Hepatocellular Carcinoma; GSVA, Gene Set Variation Analysis; APS, antigen processing and presenting machinery (APM) score; IIS, immune infiltration score; TIS, T cell infiltration score; TIDE, Tumor Immune Dysfunction, and Exclusion; AUC, Area under the curve; ROC, Receiver Operating Characteristic. ns, no significance, *p<0.05, **p<0.01, ***p<0.001, ****p<0.0001.
Among the 67 sorafenib-treated patients, the non-responder group displayed increased immune cell infiltration, including antitumor immune cells (ActCD4, ActCD8, ActDC, TcmCD4, TcmCD8, TemCD4, TemCD8, NK cells, NK T cells, CD56brightNK cells, and Th1 and Th17 cells) and immunosuppressive cells involved in tumor survival (CD56dimNK cells, TAMs, MDSCs, imDCs, neutrophils, pDCs, Tregs, and Th2 cells). Pearson's correlation analysis revealed a significantly positive association between these two types of immune cells within the TME (Figure 10C). These results suggested that antitumor inflammation might promote the differentiation and infiltration of immunosuppressive cells.
Biomarkers predictive of the immunotherapeutic effects of ICIs have been extensively studied and discussed, with their predictive efficacy thought to depend on tumor antigenicity and antigen-presentation efficiency as measured by APS, IIS, TIS, CD8, IFNγ, IFNγ.GS, PDL1, TIDE [14], and APS7 [15]. To explore the potential of immunotherapy in sorafenib-treated patients, these variables were calculated and normalized with GSVA using GSE109211.
IIS results were visualized using a heatmap (Figure 10B), which suggested that most biomarkers predicted a higher potential for ICI immunotherapy in the non-responder group. Additionally, to assess biomarker performance in predicting SR, a ROC curve was used to measure the classification effect at various thresholds. AUCs for these markers were calculated (Figure 10D), with the ROC curves for AUCs >0.5 displayed (Figure 10E). TIDE, a computational framework developed to evaluate the potential of tumor immune escape according to gene-expression profiles in cancer samples, outperformed other biomarkers at predicting SR (AUC = 0.869).
Correlation between selected genes and infiltrating immune cells
TIMER was used to investigate correlations between selected genes and immune infiltration in HCC, which includes samples from TCGA (Figure 11). The expression of CFB was associated with macrophages, whereas expressions of C2orf27A, IGF2R, and PON1 were associated with many immune cells, including neutrophils, macrophages, T cells, B cells, and DCs. These findings indicated that their functions are related to immune regulation in HCC.
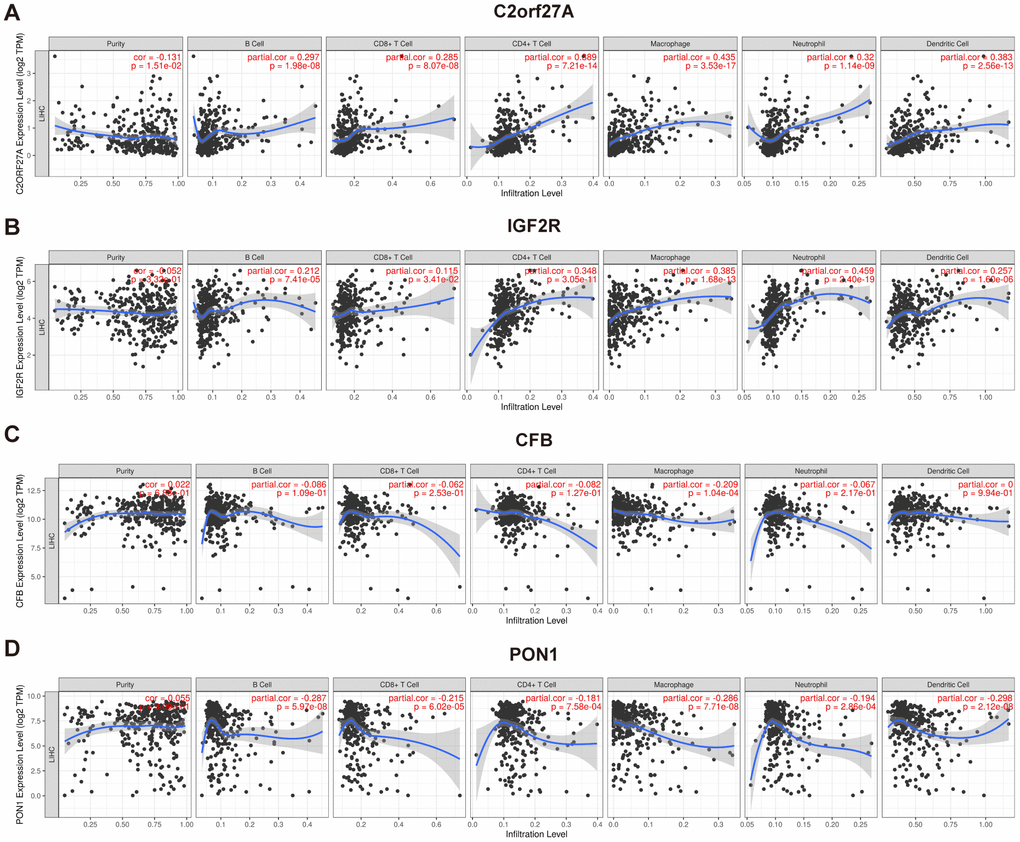
Figure 11. Association of selected genes' expression with immune infiltration cells. The correlation between selected genes and immune infiltration in HCC was evaluated by using TIMER (https://cistrome.shinyapps.io/timer/) (A) C2orf27a. (B) IGF2R. (C) CFB. (D) PON1. p<0.05 denotes significance. Each dot represents a sample in the TCGA-LIHC dataset.
Discussion
In early HCC, surgical resection and local ablation are considered the main treatment modalities, whereas sorafenib is the first-line treatment for patients with advanced unresectable HCC [16]. By inhibiting tumor cell proliferation and angiogenesis, overall survival has been notably lengthened with sorafenib treatment relative to placebo in RCTs [4, 5]. However, it is observed that few patients respond to sorafenib, and its use is associated with severe adverse side effects and drug resistance. Therefore, biomarkers are urgently needed to determine which patients are more likely to benefit from sorafenib. Here, we performed a comprehensive gene expression analysis in both SR HCC patients and in vitro.
Due to the genetic heterogeneity of HCC, the acquisition of therapeutic resistance to sorafenib is a serious clinical problem. Recently, microvascular invasion (MVI), high concentration of alpha-fetoprotein (AFP; >200 ng/mL), and a high neutrophil-to-lymphocyte ratio were reported as poor prognostic factors for sorafenib-treated HCC [4, 5, 17]. Additionally, previous studies have shown that overexpression of epidermal growth factor receptor (EGFR) or its ligand in HCC cells might result in continued SR through activation of EGFR downstream signaling. Similarly, these downstream signaling molecules, including Ras/Raf/mitogen-activated protein kinase kinase/extracellular signal-regulated kinase, reportedly affect the sensitivity of HCC to sorafenib [18]. Tasnuva [19] reported a regulatory role of miR-7 in the growth and migration of SR HCC cells by direct inhibition of expression of the tyrosine-protein kinase receptor TYRO3 and its downstream signaling network. Furthermore, a recent study reported several mechanisms potentially involved in SR, including interaction between the phosphoinositde-3 kinase/Akt and Janus kinase–STAT pathways, the vascular endothelial growth factor (VEGF)-A/VEGF receptor-2 signaling network, autophagy, and the epithelial-to-mesenchymal transition [20–24]. However, their predictive power and molecular mechanisms remain inconsistent and contradictory. In this study, using a combination of liver tissue and cell lines, our analysis eliminated individual patient differences and other factors, such as histories of alcohol and tobacco use, virus infection, family histories, and other treatments, which might have influenced the results. A total of 85 DEGs were screened from the whole genome, and GO analysis revealed that the DEGs were enriched in enzyme inhibitor activity, which is considered to be the main role of sorafenib. Furthermore, sorafenib has recently been reported to downregulate membrane-bound complement regulatory protein to potentiate the antitumor effects of rituximab and ofatumumab in chronic lymphocytic leukaemia [25]. KEGG analysis in this study revealed DEGs are primarily related to complement and coagulation cascades. These findings suggested that the complement pathway may be involved in SR-specific HCC.
We constructed PPI and ceRNA networks to further screen hub genes (mRNA) and lncRNAs. By combining Lasso regression and univariate Cox regression analyses, four key genes related to SR were identified and validated against TCGA data, revealing one lncRNA and three mRNAs exhibiting significantly higher or lower expression in HCC tissues relative to normal tissues. Among the four genes, C2orf27A and IGF2R were found to be positively correlated and CFB and PON1 were negatively correlated with the stage and tumor grade of liver cancer. Kaplan–Meier analysis subsequently showed that C2orf27A and IGF2R were negatively correlated with the survival time of liver cancer patients, whereas CFB and PON1 were associated with favorable survival times. Moreover, the role of these genes in SR was also verified in vitro. Knockdown of PON1 and CFB significantly attenuated the cytotoxicity of sorafenib in Huh7 cells, while RNA interference of IGF2R and C2orf27A showed the opposite effect.
Among the four genes, C2orf27A has not been previously reported in HCC, whereas IGF2R is reportedly related to HCC progression, particularly in regard to transarterial chemoembolisation (TACE) treatment prior to surgery, with TACE-pretreated HCC patients showing significantly higher IGF2R mRNA expression in tumor tissues [26]. Additionally, the inactivation of M6P/IGF2R occurred in the early stage of hepatocarcinogenesis, which supports the role of M6P / IGF2R as a tumor suppressor gene [27]. CFB is associated with HBV related HCC [28] and is considered as a potential predictor of response to PegIFNα therapy in patients with chronic hepatitis B [29]. PON1 is considered as a biomarker for the clinical diagnosis of early HCC and able to distinguish early HCC from liver cirrhosis patients with low AFP levels [30]. Furthermore, PON1 is potentially related to the MVI of liver cancer [31, 32]; therefore, given the correlation between MVI and sorafenib efficacy [33], PON1 might play a crucial role in the development of SR by influencing MVI, which agrees with the findings of the present study.
We then investigated the relationship between SR and the TME. Immune cells in the TME can exert both pro- and antitumor effects, with previous studies describing complex interactions between cancer cells and the TME that are implicated in HCC progression [34]. Tumor-associated neutrophils reportedly recruit macrophages and Tregs to promote the growth and development of HCC cells and their resistance to sorafenib [35]. In the present study, we found significant differences in the expression and composition of immune cells between responder and non-responder groups in sorafenib-treated HCC patients. Moreover, compared with the responder group, both antitumor cells and immune cells involved in tumor survival showed higher expression levels in the non-responder group, suggesting the potential efficacy of immunotherapy. Similar results were found for the predictive efficacy of biomarkers for ICI response, reinforcing the potential effectiveness of immunotherapy for treating sorafenib-resistant HCC. Interestingly, the expression of PD-L1 was lower in non-responders, which might contribute to poor efficacy of PD-L1 inhibitors. However, without validation, caution must be applied, as these findings might be attributed to the complexity of resistance to cancer immunotherapy. Combination of atezolizumab and bevacizumab has resulted in better overall survival and progression free survival than sorafenib in unresectable HCC [36], which highlighted the immunotherapy based on PD-L1. Furthermore, some predictive biomarkers of ICI response showed good predictive power for SR, especially TIDE, a biomarker developed to evaluate the potential of tumor immune escape (ROC = 0.869). This suggests that immune escape might play a crucial role in SR.
Evaluation of the role of selected genes in regulating the immune system with TIMER revealed their association with infiltrating immune cells in HCC tissue samples but not with tumor purity. The results suggest that CFB is mainly expressed in macrophages, whereas C2orf27A, IGF2R, and PON1 are widely expressed in many immune cells, including neutrophils, macrophages, T cells, B cells, and DCs. However, only the partial correlation coefficients between C2orf27A and macrophages and between IGF2R and neutrophils were greater than 0.4. Besides, the correlation analysis between the expression of selected genes and immune cells based on GSE109211 also revealed a close relationship between these genes and the immune system (Supplementary Table 2). These findings indicate that these genes may partly participate in the regulation of immune system in the context of HCC.
This study has some limitations. First, although expression of the four identified genes were designated as predictive biomarkers for SR and independent prognostic factors in HCC patients, the data used in this study were from online public databases based on a retrospective design [13]. Further prospective research with larger sample sizes is needed to validate these findings and explore possible clinical applications of these genes as a therapeutic strategy for HCC. Second, the information from GEO and TCGA might be biased. Although the data were validated in cell lines and clinical specimens, future investigations should expand in vivo validation. Finally, potential diagnostic and therapeutic effects have not been assessed for these genes, and additional research is needed to explore whether they are applicable as diagnostic markers or therapeutic targets.
In summary, by combining limma, STRING, MCODE, Lasso regression, and other bioinformatics tools, we identified and characterized several DEGs potentially involved in SR HCC. We identified four genes (C2orf27A, IGF2R, CFB, and PON1) as potential predictive biomarkers for SR and independent prognostic factors in HCC. Moreover, we revealed correlations between the genes and clinical cancer stage and pathological tumor grade of liver cancer, and their regulatory effects on sorafenib cytotoxicity were verified in vitro. Furthermore, TIDE showed good predictive power for SR, and these results suggest that immunotherapy based on ICIs represents an exciting prospect for treating sorafenib-resistant HCC. These findings may facilitate the development of precision therapy for patients with liver cancer, although future effectors need to be elucidated to fully reveal their contribution to SR in HCC, and validate their usefulness as diagnostic markers or therapeutic targets.
Materials and Methods
Gene-expression datasets
Gene-expression datasets for HCC patients and a Huh7 cell line were obtained from the GEO repository (http://www.ncbi.nlm.nih.gov/geo), which is an online repository of high-throughput functional genomic data submitted by the scientific community. GSE109211 [13] and GSE94550 were included in this study (GPL13938, Illumina HumanHT-12 WG-DASL V4.0 expression BeadChip; and GPL17586, Affymetrix Human Transcriptome Array 2.0 [HTA-2_0]). The GSE109211 dataset contained liver cancer tissues from 140 patients with liver cancer in the STORM clinical trial (NCT00692770) from 2008 to 2010 and included 67 patients treated with sorafenib and 73 receiving a placebo (Plac). GSE94550 contained Huh7 HCC cells, including untreated parental cells (n = 3), SR pool cells (n = 3), and SR clone A7 cells (n = 3). A7 is a specific clone derived from the SR pool and an in vitro model of HCC SR using the Huh7 cell line. Additionally, HCC RNA sequencing (RNA-seq) and clinical data from TCGA data were obtained from the University of California Santa Cruz Xena browser (https://xenabrowser.net/datapages/) [37]. All transcriptome data are freely available online, and this study was performed in compliance with GEO and TCGA data access policies.
Cell culture and agents
The human HCC cell lines LO2 and HuH-7 were purchased from Cell Bank of Shanghai Institutes for Biological Sciences, Chinese Academy of Sciences (Shanghai, China) and cultured in Dulbecco’s modified Eagle’s medium (DMEM) supplemented with 10% fetal bovine serum (FBS) in a humidified atmosphere of 95% air and 5% CO2 at 37° C. Sorafenib was obtained from MedChemExpress (New Jersey, USA). Cell Counting Kit-8 (CCK8) was purchased from Boster Biological Technology co.ltd (CA, USA). Transwell cell culture plate and matrigel matrix were from Corning (NY, USA).
Identification of differentially expressed genes (DEGs)
We downloaded the SOFT-formatted family file(s) of datasets from GEO and applied log2 conversion to normalize the gene-expression data. DEGs were screened in GSE109211 and GSE94550 using the R package “limma” [38], which is an R/Bioconductor software package used to analyze gene-expression data and especially linear models for microarray data. According to the GTF file (from gencode) and the annotation file, probes IDs were converted to the corresponding sIDs, and genes meeting the cut-off criteria (adjusted P < 0.05; |log2| fold change ≥ 1) were considered DEGs. Intersecting portions of the two datasets were detected by Venny 2.1 (https://bioinfogp.cnb.csic.es/tools/venny/index.html).
Enrichment analysis of DEGs
Cluster Profiler [39] is an R package that implements methods for statistical analysis and allows visualization of biological implications of gene clusters. Metascape [40] is a web-based portal designed to provide free gene annotation and meta-analysis tools (https://metascape.org/gp/index.html). Gene Ontology (GO) enrichment [41] enables gene annotation and analysis of their respective biological roles. The Kyoto Encyclopedia of Genes and Genomes (KEGG) [42] is a database resource that promotes an understanding of high-level functions and biological systems from large-scale molecular datasets generated by high-throughput experimental technologies. To elucidate the biological function of DEGs, “clusterprofiler” and Metascape were used to perform GO and KEGG enrichment analyses.
Protein–protein interaction (PPI) network construction and DEG module analysis
Search Tool for the Retrieval of Interacting Genes (STRING; http://string-db.org; v.11.0) [43] is a biological database and web resource of known and predicted PPIs. Cytoscape (v.3.7.2) [44] is a bioinformatics software platform used to visualize complex networks. MCODE (v.1.6) [13] is a Cytoscape application used to cluster a given network in order to identify core modules with dense connections. In this study, STRING and Cytoscape were combined to construct and visualize a PPI network, and clustered subnetworks of highly interconnected nodes from the PPI network were identified using MCODE. The screening criteria were as follows: MCODE score, >5; degree cut-off, 2; and node score cut-off, 0.2.
Integrative analysis of the competing endogenous (ce)RNA network
GPL13938 (GSE109211 platform) was designed to obtain whole-genome expression profiling of samples. Differentially expressed long noncoding RNAs (DElncRNAs) were identified and annotated using the annotation file in GTF format (gencode.v33.annotation.gtf) from the DEGs of GSE109211. Relevant lncRNA-targeted microRNAs (miRNAs) were obtained from the miRcode database (http://www.mircode.org/) [45]. Furthermore, putative target miRNAs of the DEmRNAs were predicted using three databases: miRDB (http://www.mirdb.org/) [46], miRanda (http://www.microrna.org/) [47], and TargetScan (http://www.targetscan.org) [48]. To improve analytical reliability, only target miRNAs existing in all four databases were included in the lncRNA–miRNA–mRNA network. The ceRNA network was visualized using Cytoscape.
Establishment and validation of lasso regression
HCC samples trained with sorafenib in GSE109211 were divided into responder and non-responder sets according to relapse-free survival (RFS). A risk score model of SR prediction was constructed using the Lasso method with the R package “glmnet” [49], and the penalty regularization parameter lambda (λ) was determined along with an n-fold value equal to 10. The minimal λ value was used to identify key genes. We then used the R package “pROC” [50] to evaluate the robustness of the risk score model in terms of area under the receiver operating characteristic (ROC) curve (AUC).
Biomarker screening using cox risk regression analysis
According to the RNA-seq and clinical data from TCGA-Liver Hepatocellular Carcinoma (LIHC), univariate Cox regression was performed using the "survival" R package for further variable selection to improve the predictive accuracy and interpretability of biomarkers.
UALCAN
UALCAN (http://ualcan.path.uab.edu) [51] is an interactive data-mining platform used to analyze cancer transcriptomes in TCGA. We applied UALCAN to analyze the relative expression of candidate genes between HCC and normal samples, as well as associations between gene expression and related clinicopathological parameters, in TCGA.
The human protein atlas
The Human Protein Atlas (https://www.proteinatlas.org/) is an open-access interactive database used to explore detailed information concerning protein expression and localization according to semiquantitative immunohistochemical analyses of 17 different cancer types [52]. In this study, immunohistochemistry images of protein levels between normal liver tissues and HCC tissues were compared using the Tissue Atlas (https://www.proteinatlas.org/humanproteome/tissue) and Pathology Atlas (https://www.proteinatlas.org/humanproteome/pathology).
Kaplan–Meier analysis
The Kaplan–Meier plotter (http://kmplot.com/analysis/) allows visualization of Kaplan–Meier survival curves based on data from GEO, the European Genome-Phenome Archive, and TCGA [53, 54]. Tumor patients were divided into high-expression and low-expression groups based on median values of mRNA expression, and the prognostic value of the selected genes in liver cancer was evaluated.
Real-time PCR
Total RNA of cultured cells or liver tissue was extracted using TRIzol (Invitrogen, NY, USA) according to the manufacturer's instruction. Duplicate samples were subjected to a quantitative real-time polymerase chain reaction (QRT-PCR). Then 1μg of total RNA in a 20μl reaction volume was reverse transcribed into cDNA using ReverTra Ace® qPCR RT Kit (TOYOBO, Japan), and subjected to quantitative PCR using SYBR Green Realtime PCR Master Mix (TOYOBO, Japan) with β-actin as an internal control. All primers are shown in Supplementary Table 3. Thermal cycling consisted of 55° C for 30 min, 95° C for 15 min, 40 cycles at 94° C for 30 s, 60° C for 30 s, and 72° C for 1 min.
RNA interference
To determine the role of selected genes in sorafenib treatment, Huh7 cells were transfected with siRNA or lncRNA smart silencer according to the manufacturer’s protocol. Briefly, cells were grown to 60 to 70% confluence and incubated with siRNAs or lncRNA smart silencer at a final concentration of 50 nM using LipofectamineTM 3000 (Invitrogen, NY, USA) in serum-free medium for 24 h. SiRNA and lncRNA Smart Silencer were designed and synthesized by RiboBio co.ltd (Guangzhou, China), and the sequences are shown in Supplementary Table 4.
Cell proliferation and cell invasion assay
The effect of selected genes on cell proliferation was determined by Cell counting kit 8 assay. Cells were seeded at 5000 cells/well and cultured under various concentrations of sorafenib in 96-well plates. After 48h, 10 μl of the CCK-8 solution was added and incubate for 1-4 hours in the incubator, and finally measure the absorbance at 450 nm using a microplate reader.
Cell invasion assays were performed using a Matrigel-coated transwell invasion chamber. Briefly, the cells were pretreated with RNA interference and exposed to sorafenib at 6 μmol/L for 48h. Next, the cells were resuspended in DMEM containing 0.1% bovine serum albumin and added to the upper chambers at a concentration of 0.5×10⁵ cells per well in 24-well plates. DMEM containing 10% FBS was added to the lower chambers as a chemoattractant. After 24 h, the invaded cells on the membrane’s undersurface were stained with 0.1% crystal violet.
TME analysis
The abundance of 28 immune cells in the TME [24] was quantified by single-sample gene set enrichment analysis (ssGSEA) [55, 56]. Microarray data from GSE109211 were modified and applied using the CIBERSORT with deconvolution algorithm [57]. The ssGSEA score was calculated and normalized between 0 and 1. Additionally, correlations between the infiltration of cell types involved in antitumor immunity and those involved in tumor survival were estimated by Pearson's correlation analysis. The antitumor group included the following cells: activated T cells (ActCD4 and ActCD8), activated dendritic cells (ActDCs), central memory T cells (TcmCD4 and TcmCD8), effector memory T cells (TemCD4 and TemCD8), natural killer (NK) T cells, NK cells (CD56bright/dimNK cells), and T helper 1 (Th1) and Th17 cells. The tumor-survival group comprised the following immune cells: CD56dimNK, immature DCs (imDCs), tumor-associated macrophages (TAMs), myeloid-derived suppressor cells (MDSCs), neutrophil, plasmacytoid DCs (pDCs), regulatory T cells (Tregs), and Th2 cells [56].
Calculation of immune-infiltration score
Biomarkers predictive of the immunotherapeutic effects of ICIs have been extensively studied and discussed, including the antigen processing and presenting machinery scores (APS); T cell-infiltration score (TIS); immune infiltration score (IIS); CD8, interferon γ (IFNγ), the ratio of IFN signaling in immune cells (IFNγ.GS), and PD-L1; tumor immune dysfunction and exclusion (TIDE) [15]. Besides, we conducted another analysis about calculating APS based on 7 genes from Senbabaoglu et al. [58], which were involved in the processing and presentation of antigens on MHC. We named this score as ‘APS7’. APS, APS7, IIS, and TIS were quantified using the R package “GSVA” [59] and gene lists according to a previous report [58]. IIS was defined as the mean of the standardized values of immune cells, including macrophages, DCs, B cells, eosinophils, mast cells, neutrophils, NK cell subsets, and all T cell subsets. TIS was defined as the mean of the standardized values for the following T cell subsets: CD8+, T central and effector memory cells, Th1, Th2, Th17, and Treg cells.
The TIDE score [14] was calculated online (http://tide.dfci.harvard.edu) and integrates the expression signatures of T cell dysfunction and exclusion in order to model tumor immune evasion. The calculation of scores for other biomarkers (IFNγ, CD8, PD-L1, and IFNG.GS) has been reported previously [14, 60, 61]. According to the list of genes defined in previous studies, the scores of biomarkers were quantified as the average expression level of the gene set. IFNγ-related biomarkers included C-X-C chemokine ligand (CXCL)10, CXCL9, IFNγ, signal transducer and activator of transcription 1 (STAT1), indoleamine 2,3-dioxygenase 1, and human leukocyte antigen–DR isotype α. CD8-related biomarkers including the genes CD8A and CD8B. Immune scores were normalized to a uniform distribution (range: 0–1), and the AUC for each biomarker was calculated.
Correlation analysis between selected genes and infiltrating immune cells
To investigate correlations between selected genes and immune infiltration in HCC, we used TIMER (https://cistrome.shinyapps.io/timer/) [62], which includes 10,897 samples across diverse cancer types from TCGA, to evaluate levels of six types of tumor-infiltrating immune cells (B cells, CD4 T cells, CD8 T cells, macrophages, neutrophils, and DCs).
Statistical analysis
Most of the statistical analyses were conducted using the bioinformatic tools mentioned above. As to experimental validation, data were analyzed and visualized by using GraphPad Prism 8 software. Independent-sample t-test or Mann–Whitney U test was done for independent variables. Differences were considered statistically significant if p <0.05 *; p <0.01 **; p <0.001***; p<0.0001****. Results are expressed as the mean ± standard error of mean.
Author Contributions
All authors designed the study, interpreted the findings and revised the manuscript. Wei Yuan, Ran Tao and Da Huang carried out data management and statistical analysis and drafted the manuscript. Weiming Yan and Guanxin Shen helped with English language editing and data management. Qin Ning performed project administration.
Acknowledgments
Thank all health care workers, researchers and civil servants all over the world for their contribution and sacrifice in protecting lives during the COVID-19 pandemic, especially my predecessors and colleagues in Wuhan.
Conflicts of Interest
The authors declare no conflicts of interest.
Funding
This work is supported by the Chinese National Thirteenth Five Years Project in Science and Technology for Infections Disease (2017ZX10202201).
References
- 1. Ferlay J, Soerjomataram I, Dikshit R, Eser S, Mathers C, Rebelo M, Parkin DM, Forman D, Bray F. Cancer incidence and mortality worldwide: sources, methods and major patterns in GLOBOCAN 2012. Int J Cancer. 2015; 136:E359–86. https://doi.org/10.1002/ijc.29210 [PubMed]
- 2. Starley BQ, Calcagno CJ, Harrison SA. Nonalcoholic fatty liver disease and hepatocellular carcinoma: a weighty connection. Hepatology. 2010; 51:1820–32. https://doi.org/10.1002/hep.23594 [PubMed]
- 3. Yang JD, Roberts LR. Hepatocellular carcinoma: a global view. Nat Rev Gastroenterol Hepatol. 2010; 7:448–58. https://doi.org/10.1038/nrgastro.2010.100 [PubMed]
- 4. Chen QW, Ying HF, Gao S, Shen YH, Meng ZQ, Chen H, Chen Z, Teng WJ. Radiofrequency ablation plus chemoembolization versus radiofrequency ablation alone for hepatocellular carcinoma: a systematic review and meta-analysis. Clin Res Hepatol Gastroenterol. 2016; 40:309–14. https://doi.org/10.1016/j.clinre.2015.07.008 [PubMed]
- 5. Llovet JM, Ricci S, Mazzaferro V, Hilgard P, Gane E, Blanc JF, de Oliveira AC, Santoro A, Raoul JL, Forner A, Schwartz M, Porta C, Zeuzem S, et al, and SHARP Investigators Study Group. Sorafenib in advanced hepatocellular carcinoma. N Engl J Med. 2008; 359:378–90. https://doi.org/10.1056/NEJMoa0708857 [PubMed]
- 6. Kok VC, Chen YC, Chen YY, Su YC, Ku MC, Kuo JT, Yoshida GJ. Sorafenib with transarterial chemoembolization achieves improved survival vs. Sorafenib alone in advanced hepatocellular carcinoma: a nationwide population-based cohort study. Cancers (Basel). 2019; 11:985. https://doi.org/10.3390/cancers11070985 [PubMed]
- 7. Awada A, Gil T, Whenham N, Van Hamme J, Besse-Hammer T, Brendel E, Delesen H, Joosten MC, Lathia CD, Loembé BA, Piccart-Ghebart M, Hendlisz A. Safety and pharmacokinetics of sorafenib combined with capecitabine in patients with advanced solid tumors: results of a phase 1 trial. J Clin Pharmacol. 2011; 51:1674–84. https://doi.org/10.1177/0091270010386226 [PubMed]
- 8. Kan X, Jing Y, Wan QY, Pan JC, Han M, Yang Y, Zhu M, Wang Q, Liu KH. Sorafenib combined with percutaneous radiofrequency ablation for the treatment of medium-sized hepatocellular carcinoma. Eur Rev Med Pharmacol Sci. 2015; 19:247–55. [PubMed]
- 9. Freese K, Seitz T, Dietrich P, Lee SM, Thasler WE, Bosserhoff A, Hellerbrand C. Histone deacetylase expressions in hepatocellular carcinoma and functional effects of histone deacetylase inhibitors on liver cancer cells in vitro. Cancers (Basel). 2019; 11:1587. https://doi.org/10.3390/cancers11101587 [PubMed]
- 10. Lachenmayer A, Toffanin S, Cabellos L, Alsinet C, Hoshida Y, Villanueva A, Minguez B, Tsai HW, Ward SC, Thung S, Friedman SL, Llovet JM. Combination therapy for hepatocellular carcinoma: additive preclinical efficacy of the HDAC inhibitor panobinostat with sorafenib. J Hepatol. 2012; 56:1343–50. https://doi.org/10.1016/j.jhep.2012.01.009 [PubMed]
- 11. Hsu CH, Shen YC, Lin ZZ, Chen PJ, Shao YY, Ding YH, Hsu C, Cheng AL. Phase II study of combining sorafenib with metronomic tegafur/uracil for advanced hepatocellular carcinoma. J Hepatol. 2010; 53:126–31. https://doi.org/10.1016/j.jhep.2010.01.035 [PubMed]
- 12. Zhu AX, Finn RS, Edeline J, Cattan S, Ogasawara S, Palmer D, Verslype C, Zagonel V, Fartoux L, Vogel A, Sarker D, Verset G, Chan SL, et al, and KEYNOTE-224 investigators. Pembrolizumab in patients with advanced hepatocellular carcinoma previously treated with sorafenib (KEYNOTE-224): a non-randomised, open-label phase 2 trial. Lancet Oncol. 2018; 19:940–52. https://doi.org/10.1016/S1470-2045(18)30351-6 [PubMed]
- 13. Pinyol R, Montal R, Bassaganyas L, Sia D, Takayama T, Chau GY, Mazzaferro V, Roayaie S, Lee HC, Kokudo N, Zhang Z, Torrecilla S, Moeini A, et al. Molecular predictors of prevention of recurrence in HCC with sorafenib as adjuvant treatment and prognostic factors in the phase 3 STORM trial. Gut. 2019; 68:1065–75. https://doi.org/10.1136/gutjnl-2018-316408 [PubMed]
- 14. Jiang P, Gu S, Pan D, Fu J, Sahu A, Hu X, Li Z, Traugh N, Bu X, Li B, Liu J, Freeman GJ, Brown MA, et al. Signatures of T cell dysfunction and exclusion predict cancer immunotherapy response. Nat Med. 2018; 24:1550–58. https://doi.org/10.1038/s41591-018-0136-1 [PubMed]
- 15. Wang S, He Z, Wang X, Li H, Liu XS. Antigen presentation and tumor immunogenicity in cancer immunotherapy response prediction. Elife. 2019; 8:e49020. https://doi.org/10.7554/eLife.49020 [PubMed]
- 16. Heimbach JK, Kulik LM, Finn RS, Sirlin CB, Abecassis MM, Roberts LR, Zhu AX, Murad MH, Marrero JA. AASLD guidelines for the treatment of hepatocellular carcinoma. Hepatology. 2018; 67:358–80. https://doi.org/10.1002/hep.29086 [PubMed]
- 17. European Association For The Study Of The Liver, and European Organisation For Research And Treatment Of Cancer. EASL-EORTC clinical practice guidelines: management of hepatocellular carcinoma. J Hepatol. 2012; 56:908–43. https://doi.org/10.1016/j.jhep.2011.12.001 [PubMed]
- 18. Zhang Z, Zhou X, Shen H, Wang D, Wang Y. Phosphorylated ERK is a potential predictor of sensitivity to sorafenib when treating hepatocellular carcinoma: evidence from an in vitro study. BMC Med. 2009; 7:41. https://doi.org/10.1186/1741-7015-7-41 [PubMed]
- 19. Kabir TD, Ganda C, Brown RM, Beveridge DJ, Richardson KL, Chaturvedi V, Candy P, Epis M, Wintle L, Kalinowski F, Kopp C, Stuart LM, Yeoh GC, et al. A microRNA-7/growth arrest specific 6/TYRO3 axis regulates the growth and invasiveness of sorafenib-resistant cells in human hepatocellular carcinoma. Hepatology. 2018; 67:216–31. https://doi.org/10.1002/hep.29478 [PubMed]
- 20. Morgensztern D, McLeod HL. PI3K/Akt/mTOR pathway as a target for cancer therapy. Anticancer Drugs. 2005; 16:797–803. https://doi.org/10.1097/01.cad.0000173476.67239.3b [PubMed]
- 21. Chen KF, Tai WT, Hsu CY, Huang JW, Liu CY, Chen PJ, Kim I, Shiau CW. Blockade of STAT3 activation by sorafenib derivatives through enhancing SHP-1 phosphatase activity. Eur J Med Chem. 2012; 55:220–27. https://doi.org/10.1016/j.ejmech.2012.07.023 [PubMed]
- 22. Shimizu S, Takehara T, Hikita H, Kodama T, Tsunematsu H, Miyagi T, Hosui A, Ishida H, Tatsumi T, Kanto T, Hiramatsu N, Fujita N, Yoshimori T, Hayashi N. Inhibition of autophagy potentiates the antitumor effect of the multikinase inhibitor sorafenib in hepatocellular carcinoma. Int J Cancer. 2012; 131:548–57. https://doi.org/10.1002/ijc.26374 [PubMed]
- 23. Marcucci F, Stassi G, De Maria R. Epithelial-mesenchymal transition: a new target in anticancer drug discovery. Nat Rev Drug Discov. 2016; 15:311–25. https://doi.org/10.1038/nrd.2015.13 [PubMed]
- 24. Llovet JM. Focal gains of VEGFA: candidate predictors of sorafenib response in hepatocellular carcinoma. Cancer Cell. 2014; 25:560–62. https://doi.org/10.1016/j.ccr.2014.04.019 [PubMed]
- 25. Dwojak M, Bobrowicz M, Bil J, Bojarczuk K, Pyrzynska B, Siernicka M, Malenda A, Lech-Maranda E, Tomczak W, Giannopoulos K, Golab J, Winiarska M. Sorafenib improves rituximab and ofatumumab efficacy by decreasing the expression of complement regulatory proteins. Blood Cancer J. 2015; 5:e300. https://doi.org/10.1038/bcj.2015.27 [PubMed]
- 26. Lautem A, Simon F, Hoppe-Lotichius M, Mittler J, Vollmar J, Schad A, Düber C, Galle PR, Otto G, Zimmermann T, Lang H. Expression and prognostic significance of insulin-like growth factor-2 receptor in human hepatocellular carcinoma and the influence of transarterial chemoembolization. Oncol Rep. 2019; 41:2299–310. https://doi.org/10.3892/or.2019.6995 [PubMed]
- 27. Yamada T, De Souza AT, Finkelstein S, Jirtle RL. Loss of the gene encoding mannose 6-phosphate/insulin-like growth factor II receptor is an early event in liver carcinogenesis. Proc Natl Acad Sci USA. 1997; 94:10351–55. https://doi.org/10.1073/pnas.94.19.10351 [PubMed]
- 28. He X, Wang Y, Zhang W, Li H, Luo R, Zhou Y, Liao CL, Huang H, Lv X, Xie Z, He M. Screening differential expression of serum proteins in AFP-negative HBV-related hepatocellular carcinoma using iTRAQ -MALDI-MS/MS. Neoplasma. 2014; 61:17–26. [PubMed]
- 29. Chen H, Sun J, Zhou B, Peng J, Xie Q, Liang X, Fan R, Conran C, Xu J, Ji Y, Zhang X, Sun L, Jia J, et al. A missense variant in complement factor B (CFB) is a potential predictor of 24-week off-treatment response to PegIFNα therapy in Chinese HBeAg-positive chronic hepatitis B patients. Aliment Pharmacol Ther. 2020; 51:469–78. https://doi.org/10.1111/apt.15624 [PubMed]
- 30. Zhang S, Jiang K, Zhang Q, Guo K, Liu Y. Serum fucosylated paraoxonase 1 as a potential glycobiomarker for clinical diagnosis of early hepatocellular carcinoma using ELISA index. Glycoconj J. 2015; 32:119–25. https://doi.org/10.1007/s10719-015-9576-8 [PubMed]
- 31. Huang C, Wang Y, Liu S, Ding G, Liu W, Zhou J, Kuang M, Ji Y, Kondo T, Fan J. Quantitative proteomic analysis identified paraoxonase 1 as a novel serum biomarker for microvascular invasion in hepatocellular carcinoma. J Proteome Res. 2013; 12:1838–46. https://doi.org/10.1021/pr3011815 [PubMed]
- 32. Ding GY, Zhu XD, Ji Y, Shi GM, Shen YH, Zhou J, Fan J, Sun HC, Huang C. Serum PON1 as a biomarker for the estimation of microvascular invasion in hepatocellular carcinoma. Ann Transl Med. 2020; 8:204. https://doi.org/10.21037/atm.2020.01.44 [PubMed]
- 33. Kulik L, El-Serag HB. Epidemiology and management of hepatocellular carcinoma. Gastroenterology. 2019; 156:477–91.e1. https://doi.org/10.1053/j.gastro.2018.08.065 [PubMed]
- 34. Gajewski TF, Schreiber H, Fu YX. Innate and adaptive immune cells in the tumor microenvironment. Nat Immunol. 2013; 14:1014–22. https://doi.org/10.1038/ni.2703 [PubMed]
- 35. Zhou SL, Zhou ZJ, Hu ZQ, Huang XW, Wang Z, Chen EB, Fan J, Cao Y, Dai Z, Zhou J. Tumor-associated neutrophils recruit macrophages and T-regulatory cells to promote progression of hepatocellular carcinoma and resistance to sorafenib. Gastroenterology. 2016; 150:1646–58.e17. https://doi.org/10.1053/j.gastro.2016.02.040 [PubMed]
- 36. Finn RS, Qin S, Ikeda M, Galle PR, Ducreux M, Kim TY, Kudo M, Breder V, Merle P, Kaseb AO, Li D, Verret W, Xu DZ, et al, and IMbrave150 Investigators. Atezolizumab plus bevacizumab in unresectable hepatocellular carcinoma. N Engl J Med. 2020; 382:1894–905. https://doi.org/10.1056/NEJMoa1915745 [PubMed]
- 37. Goldman M, Craft B, Hastie M, Repečka K, McDade F, Kamath A, Banerjee A, Luo Y, Rogers D, Brooks AN, Zhu J, Haussler D. The UCSC Xena platform for public and private cancer genomics data visualization and interpretation. bioRxiv. 2019. [Epub ahead of print]. https://doi.org/10.1101/326470
- 38. Ritchie ME, Phipson B, Wu D, Hu Y, Law CW, Shi W, Smyth GK. Limma powers differential expression analyses for RNA-sequencing and microarray studies. Nucleic Acids Res. 2015; 43:e47. https://doi.org/10.1093/nar/gkv007 [PubMed]
- 39. Yu G, Wang LG, Han Y, He QY. clusterProfiler: an R package for comparing biological themes among gene clusters. OMICS. 2012; 16:284–87. https://doi.org/10.1089/omi.2011.0118 [PubMed]
- 40. Zhou Y, Zhou B, Pache L, Chang M, Khodabakhshi AH, Tanaseichuk O, Benner C, Chanda SK. Metascape provides a biologist-oriented resource for the analysis of systems-level datasets. Nat Commun. 2019; 10:1523. https://doi.org/10.1038/s41467-019-09234-6 [PubMed]
- 41. The Gene Ontology Consortium. Expansion of the Gene Ontology knowledgebase and resources. Nucleic Acids Res. 2017; 45:D331–D338. https://doi.org/10.1093/nar/gkw1108 [PubMed]
- 42. Kanehisa M, Furumichi M, Tanabe M, Sato Y, Morishima K. KEGG: new perspectives on genomes, pathways, diseases and drugs. Nucleic Acids Res. 2017; 45:D353–61. https://doi.org/10.1093/nar/gkw1092 [PubMed]
- 43. Szklarczyk D, Gable AL, Lyon D, Junge A, Wyder S, Huerta-Cepas J, Simonovic M, Doncheva NT, Morris JH, Bork P, Jensen LJ, Mering CV. STRING v11: protein-protein association networks with increased coverage, supporting functional discovery in genome-wide experimental datasets. Nucleic Acids Res. 2019; 47:D607–13. https://doi.org/10.1093/nar/gky1131 [PubMed]
- 44. Shannon P, Markiel A, Ozier O, Baliga NS, Wang JT, Ramage D, Amin N, Schwikowski B, Ideker T. Cytoscape: a software environment for integrated models of biomolecular interaction networks. Genome Res. 2003; 13:2498–504. https://doi.org/10.1101/gr.1239303 [PubMed]
- 45. Jeggari A, Marks DS, Larsson E. miRcode: a map of putative microRNA target sites in the long non-coding transcriptome. Bioinformatics. 2012; 28:2062–63. https://doi.org/10.1093/bioinformatics/bts344 [PubMed]
- 46. Chen Y, Wang X. miRDB: an online database for prediction of functional microRNA targets. Nucleic Acids Res. 2020; 48:D127–31. https://doi.org/10.1093/nar/gkz757 [PubMed]
- 47. Betel D, Wilson M, Gabow A, Marks DS, Sander C. The microRNA.org resource: targets and expression. Nucleic Acids Res. 2008; 36:D149–53. https://doi.org/10.1093/nar/gkm995 [PubMed]
- 48. Agarwal V, Bell GW, Nam JW, Bartel DP. Predicting effective microRNA target sites in mammalian mRNAs. Elife. 2015; 4:e05005. https://doi.org/10.7554/eLife.05005 [PubMed]
- 49. Friedman J, Hastie T, Tibshirani R. Regularization paths for generalized linear models via coordinate descent. J Stat Softw. 2010; 33:1–22. [PubMed]
- 50. Robin X, Turck N, Hainard A, Tiberti N, Lisacek F, Sanchez JC, Müller M. pROC: an open-source package for R and S+ to analyze and compare ROC curves. BMC Bioinformatics. 2011; 12:77. https://doi.org/10.1186/1471-2105-12-77 [PubMed]
- 51. Chandrashekar DS, Bashel B, Balasubramanya SA, Creighton CJ, Ponce-Rodriguez I, Chakravarthi BV, Varambally S. UALCAN: a portal for facilitating tumor subgroup gene expression and survival analyses. Neoplasia. 2017; 19:649–58. https://doi.org/10.1016/j.neo.2017.05.002 [PubMed]
- 52. Uhlen M, Zhang C, Lee S, Sjöstedt E, Fagerberg L, Bidkhori G, Benfeitas R, Arif M, Liu Z, Edfors F, Sanli K, von Feilitzen K, Oksvold P, et al. A pathology atlas of the human cancer transcriptome. Science. 2017; 357:eaan2507. https://doi.org/10.1126/science.aan2507 [PubMed]
- 53. Györffy B, Lanczky A, Eklund AC, Denkert C, Budczies J, Li Q, Szallasi Z. An online survival analysis tool to rapidly assess the effect of 22,277 genes on breast cancer prognosis using microarray data of 1,809 patients. Breast Cancer Res Treat. 2010; 123:725–31. https://doi.org/10.1007/s10549-009-0674-9 [PubMed]
- 54. Nagy Á, Lánczky A, Menyhárt O, Győrffy B. Validation of miRNA prognostic power in hepatocellular carcinoma using expression data of independent datasets. Sci Rep. 2018; 8:9227. https://doi.org/10.1038/s41598-018-27521-y [PubMed]
- 55. Barbie DA, Tamayo P, Boehm JS, Kim SY, Moody SE, Dunn IF, Schinzel AC, Sandy P, Meylan E, Scholl C, Fröhling S, Chan EM, Sos ML, et al. Systematic RNA interference reveals that oncogenic KRAS-driven cancers require TBK1. Nature. 2009; 462:108–12. https://doi.org/10.1038/nature08460 [PubMed]
- 56. Charoentong P, Finotello F, Angelova M, Mayer C, Efremova M, Rieder D, Hackl H, Trajanoski Z. Pan-cancer immunogenomic analyses reveal genotype-immunophenotype relationships and predictors of response to checkpoint blockade. Cell Rep. 2017; 18:248–62. https://doi.org/10.1016/j.celrep.2016.12.019 [PubMed]
- 57. Newman AM, Liu CL, Green MR, Gentles AJ, Feng W, Xu Y, Hoang CD, Diehn M, Alizadeh AA. Robust enumeration of cell subsets from tissue expression profiles. Nat Methods. 2015; 12:453–57. https://doi.org/10.1038/nmeth.3337 [PubMed]
- 58. Şenbabaoğlu Y, Gejman RS, Winer AG, Liu M, Van Allen EM, de Velasco G, Miao D, Ostrovnaya I, Drill E, Luna A, Weinhold N, Lee W, Manley BJ, et al. Tumor immune microenvironment characterization in clear cell renal cell carcinoma identifies prognostic and immunotherapeutically relevant messenger RNA signatures. Genome Biol. 2016; 17:231. https://doi.org/10.1186/s13059-016-1092-z [PubMed]
- 59. Hänzelmann S, Castelo R, Guinney J. GSVA: gene set variation analysis for microarray and RNA-seq data. BMC Bioinformatics. 2013; 14:7. https://doi.org/10.1186/1471-2105-14-7 [PubMed]
- 60. Ayers M, Lunceford J, Nebozhyn M, Murphy E, Loboda A, Kaufman DR, Albright A, Cheng JD, Kang SP, Shankaran V, Piha-Paul SA, Yearley J, Seiwert TY, et al. IFN-γ-related mRNA profile predicts clinical response to PD-1 blockade. J Clin Invest. 2017; 127:2930–40. https://doi.org/10.1172/JCI91190 [PubMed]
- 61. Benci JL, Johnson LR, Choa R, Xu Y, Qiu J, Zhou Z, Xu B, Ye D, Nathanson KL, June CH, Wherry EJ, Zhang NR, Ishwaran H, et al. Opposing functions of interferon coordinate adaptive and innate immune responses to cancer immune checkpoint blockade. Cell. 2019; 178:933–48.e14. https://doi.org/10.1016/j.cell.2019.07.019 [PubMed]
- 62. Li T, Fan J, Wang B, Traugh N, Chen Q, Liu JS, Li B, Liu XS. TIMER: a web server for comprehensive analysis of tumor-infiltrating immune cells. Cancer Res. 2017; 77:e108–10. https://doi.org/10.1158/0008-5472.CAN-17-0307 [PubMed]