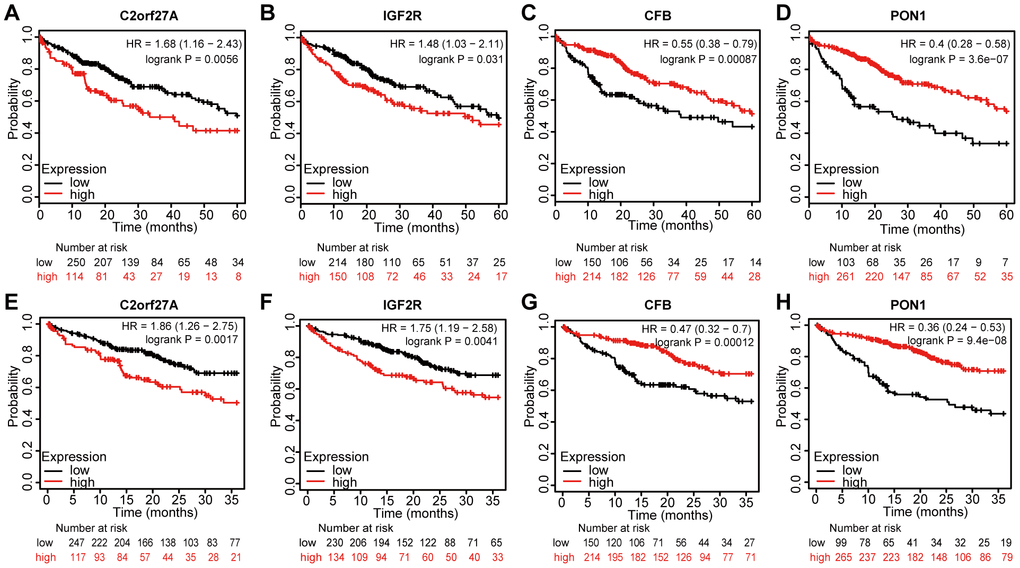
Figure 8.Prognostic value of selected genes in liver cancer patients (Kaplan-Meier Plotter). (A, B, E, F) Kaplan–Meier survival curves comparing the samples with high expression of the four selected genes with those with low expression in liver cancer conducted within 5 years by using Kaplan–Meier plotter. (C, D, G, H) Kaplan–Meier survival curves conducted comparing the samples with high expression of the four selected genes with those with low expression in liver cancer conducted within 3 years by using Kaplan–Meier plotter. HR, hazard ratio.