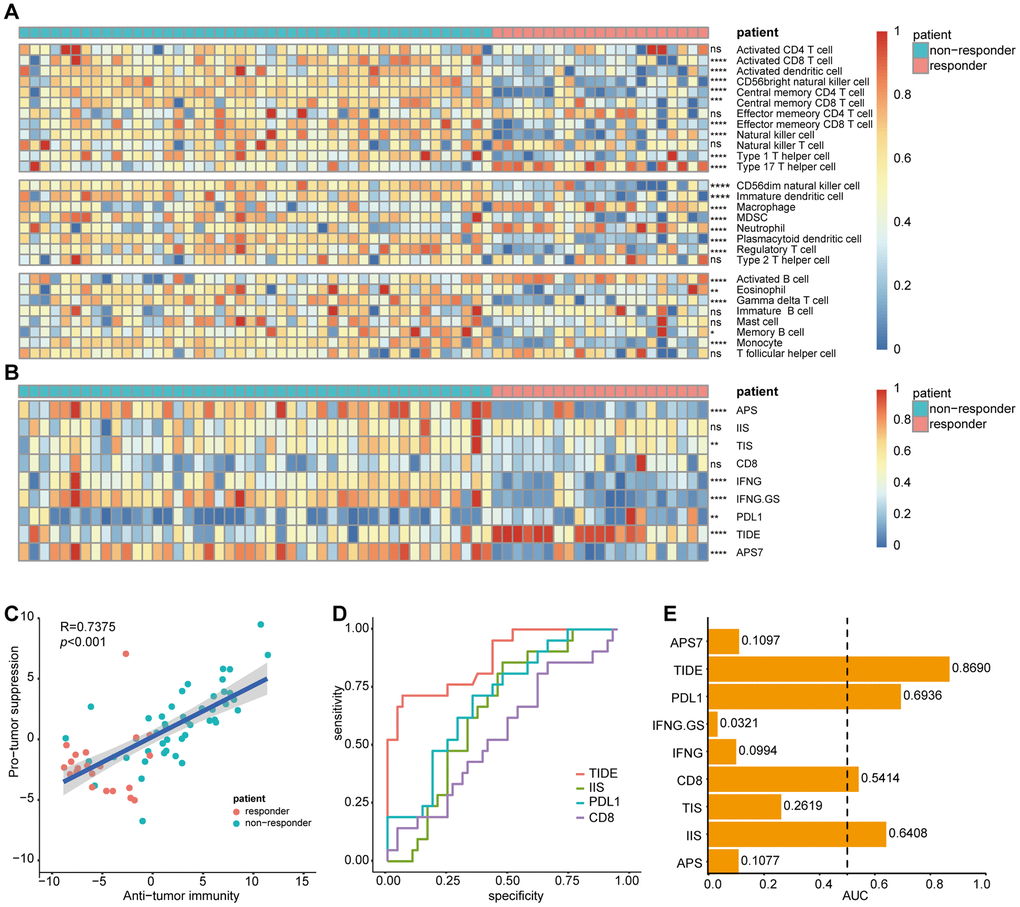
Figure 10.Correlation of sorafenib resistance and immune cell infiltration heterogeneity. Single-sample gene set enrichment analysis identifying the relative infiltration of immune cell populations for 67 HCC samples treated with sorafenib in GSE109211. The relative infiltration of each cell type is normalized into a z-score. Biomarkers can predict immunotherapy response were calculated and normalized with GSVA, including APS, IIS, TIS, CD8, IFNG, IFNG.GS, PDL1, TIDE, and APS7. (A, B) Heatmap of immune cell z-scores and immune infiltration scores. P values describe differences between the responder and non-responder. (C) Pearson's correlation between infiltration of cell types executing anti-tumor reactivity (ActCD4, ActCD8, ActDC, TcmCD4, TcmCD8, TemCD4, TemCD8, NKT, NK, CD56brightNK, Th1 and Th17 cells) and cell types delivering pro-tumor suppression (CD56dimNK, imDC, TAM, MDSC, Neutrophil, pDC, Treg, and Th2 cells). The shaded area represents 95% confidence interval. (D) AUC of immune infiltration scores. (E) ROC curves for the performance of immune infiltration scores in predicting sorafenib resistance in HCC patients. Only biomarkers with AUC greater than 0.5 were displayed. HCC, Hepatocellular Carcinoma; GSVA, Gene Set Variation Analysis; APS, antigen processing and presenting machinery (APM) score; IIS, immune infiltration score; TIS, T cell infiltration score; TIDE, Tumor Immune Dysfunction, and Exclusion; AUC, Area under the curve; ROC, Receiver Operating Characteristic. ns, no significance, *p<0.05, **p<0.01, ***p<0.001, ****p<0.0001.