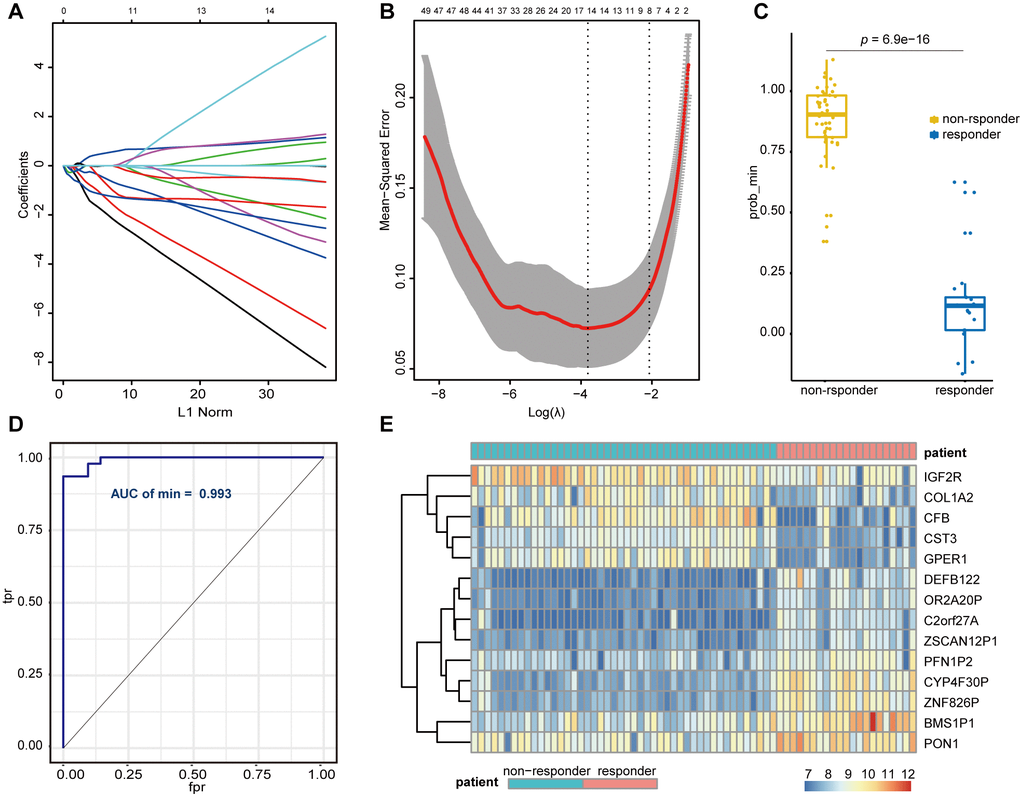
Figure 5.Lasso regression establishment and validation in GSE109211. (A) LASSO coefficient profiles of the genes associated with the sorafenib resistance in HCC patients. (B) The mean-squared error was plotted versus log (lambda). The two dashed lines indicate two special lambda values, one is lambda.min and the other is lambda.1se, and the lambda between the two values is considered appropriate. We finally chose lambda.min, because it’s the value of Lambda that gives a minimum mean cross-validated error. (C) Wilcoxon Signed Rank Test was performed to compare the sorafenib non-responder and responder. (D) ROC curves for the performance of the Lasso regression model in predicting sorafenib resistance in HCC patients. (E) Heatmap of differentially expressed genes that were enrolled in the Lasso regression model. LASSO, Least absolute shrinkage and selection operator; HCC, Hepatocellular Carcinoma; ROC, Receiver Operating Characteristic; tpr, true-positive rates; fpr, false-positive rates.