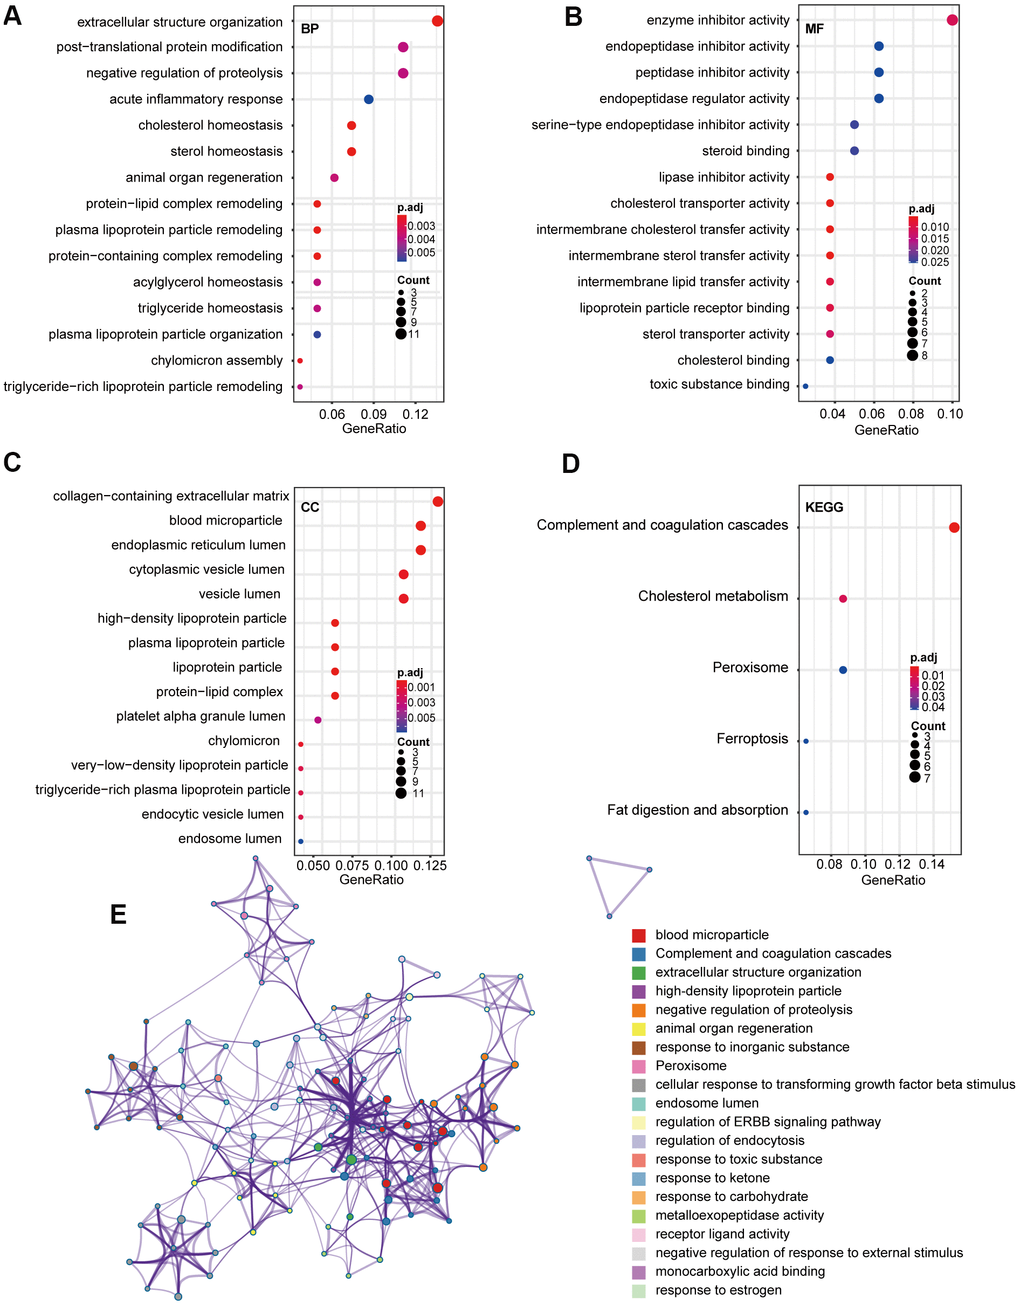
Figure 2.GO and KEGG pathway analysis of 85 overlap DEGs. (A) Biological process GO terms for DEGs. (B) Molecular function GO terms for DEGs. (C) Cellular component GO terms for DEGs. (D) KEGG analysis for DEGs. (E) Enriched Ontology Clusters of statistically enriched terms. Each term is represented by a circle node, where its size is proportional to the number of input genes that fall into that term, and its color represents its cluster identity. The y-axis represents the pathways and the x-axis represents enriched gene numbers, and the color means adjust P-value. The netplot of KEGG pathways means the enrichment of genes in different pathways. And the number adjacent to nodes stands for gene ID. GO, Gene Ontology; BP, biological process; MF, molecular function; CC, cellular component; KEGG, Kyoto Encyclopedia of Genes and Genomes; DEGs, differentially expressed genes.