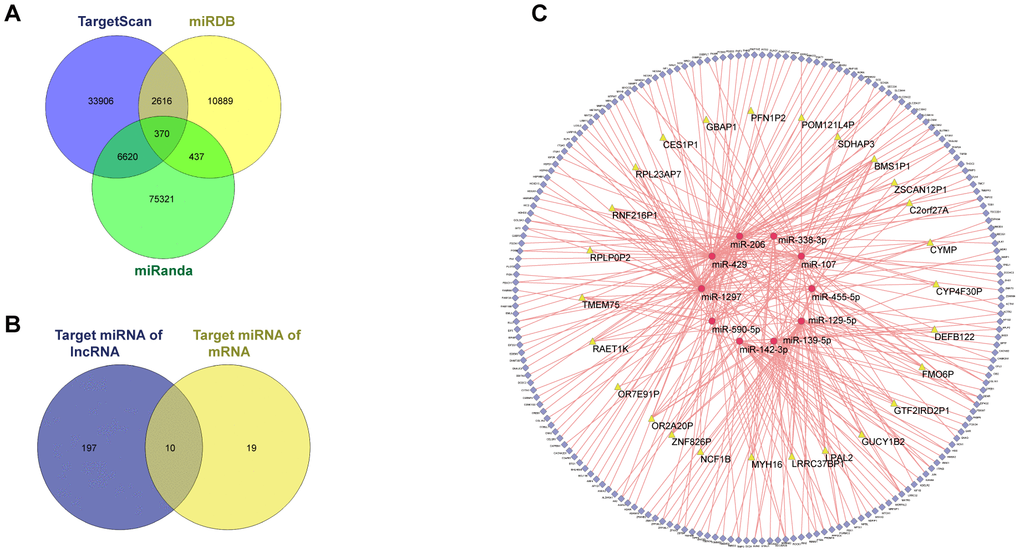
Figure 4.ceRNA network of GSE109211. Among the 3714, DEGs between the responder and non-responder in GSE109211, 43 DElncRNAs and 2875 DEmRNAs were identified. miRDB, miRanda, and TargetScan were used to predict the potential miRNA target by DEmRNAs. Only the miRNA-mRNA pairs that exist in all three databases were enrolled in the ceRNA network. The miRcode was applied to predict the potential miRNA target by DElncRNAs. As a result, a total of 26 lncRNAs, 194 mRNAs, and 10 miRNAs were enrolled in the ceRNA network. (A) Venn diagram of miRNA-mRNA pairs. (B) Venn diagram of target miRNAs. (C) CeRNA network of GSE109211. The yellow, red, and blue represent lncRNA, miRNA, and mRNA, respectively. Pink edges indicate lncRNA-miRNA-mRNA interactions. DEGs, differentially expressed genes; LncRNA, long non-coding RNA; miRNA, micro RNA; mRNA, messenger RNA; CeRNA, competing endogenous RNA.