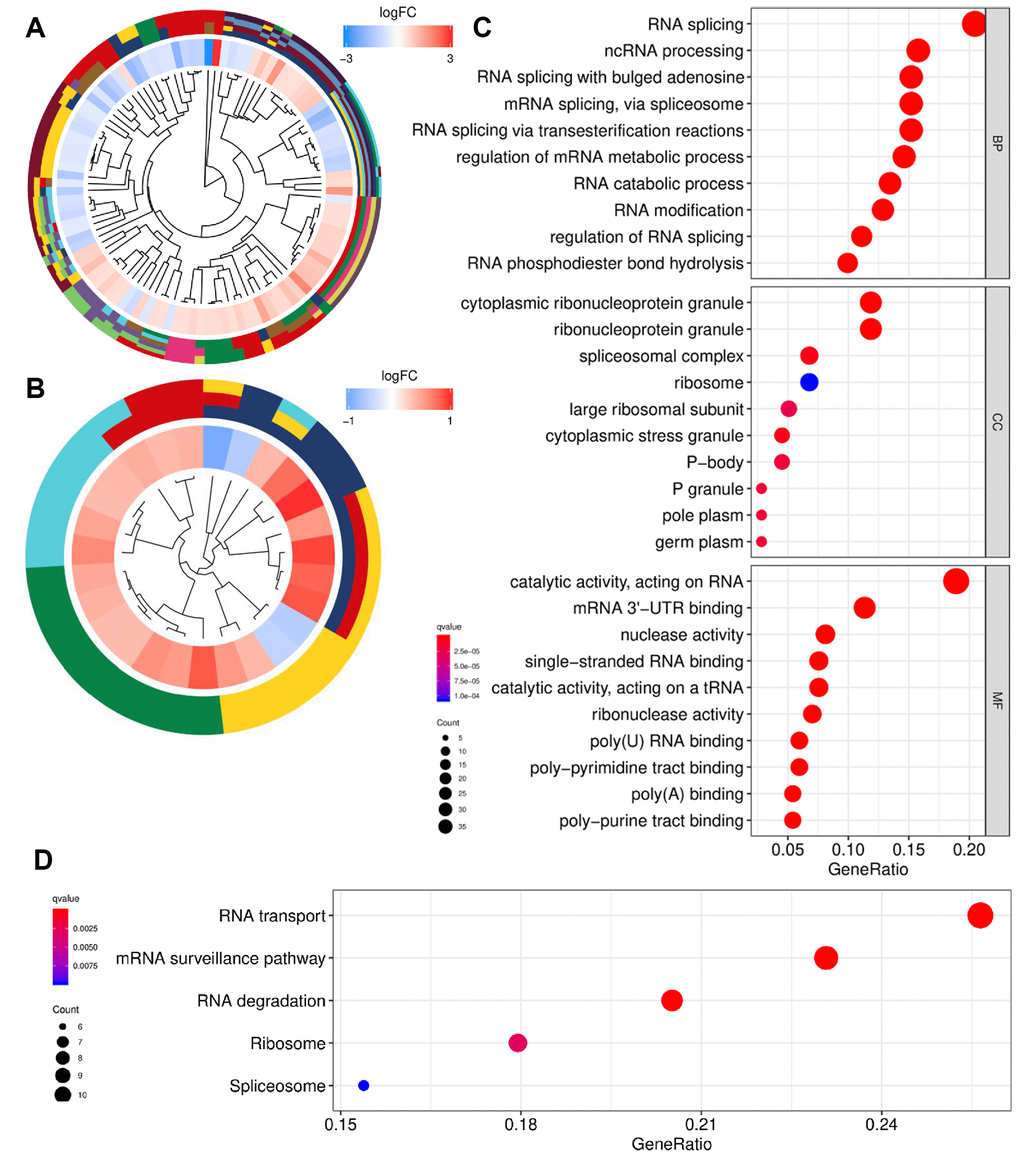
Figure 3.Functional enrichment analysis of differentially expressed RBPs. (A) GO cluster. (B) KEGG cluster. (C) GO analysis of representative RBPs including BP, CC and MF. (D) KEGG analysis of representative RBPs. For (A and B), the innermost part shows the hierarchical clustering of the RBPs. The middle part represents the expression profiles of RBPs, in which the color layout from blue to red indicates the expression level of RBPs from down-regulation to up-regulation. And the outermost part represents the GO terms (A) and KEGG pathways (B) associated with RBPs. The y-axis shows enriched GO terms. RBPs: RNA-binding proteins; GO: Gene Ontology; KEGG: Kyoto Encyclopedia of Genes and Genomes; BP: biological process; CC: cellular component; MF: molecular function.