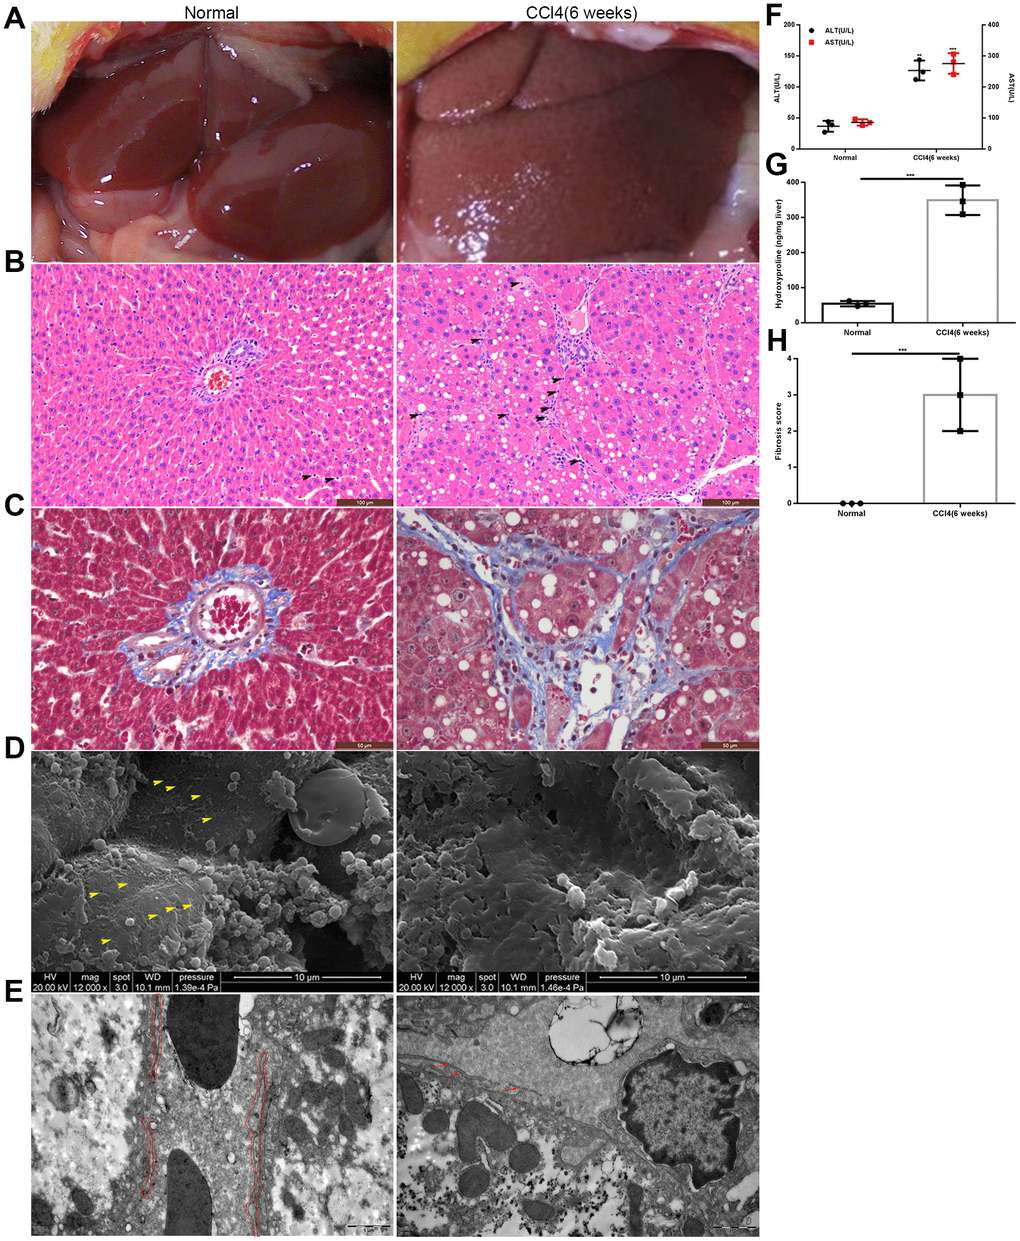
Figure 1.Establishment of the rat model of liver fibrosis. (A) General appearance of liver in the model group and the normal control group. (B, C) HE and Masson staining of liver tissues from the model group and normal control group: inflammatory cells accumulated in the hepatic sinusoids and collagen fibers deposited in the space of Disse (the black head of arrow indicates infiltrating lymphocytes). (D) SEM: defenestration changes in the model group compared with those in the normal control group (the yellow head of arrow indicates fenestrae). (E) TEM: formation of a basement membrane in the model group compared with that in the normal control group (the red irregular area in the normal control group indicated LSECs; and in the model group, the red arrow showed the discontinuous basement membrane). (F) Transaminase levels in the model group and the normal control group. (G) Hydroxyproline content in the model group and the normal control group. (H) Liver fibrosis score in the model group and the normal control group. **p < 0.01, ***p < 0.001.