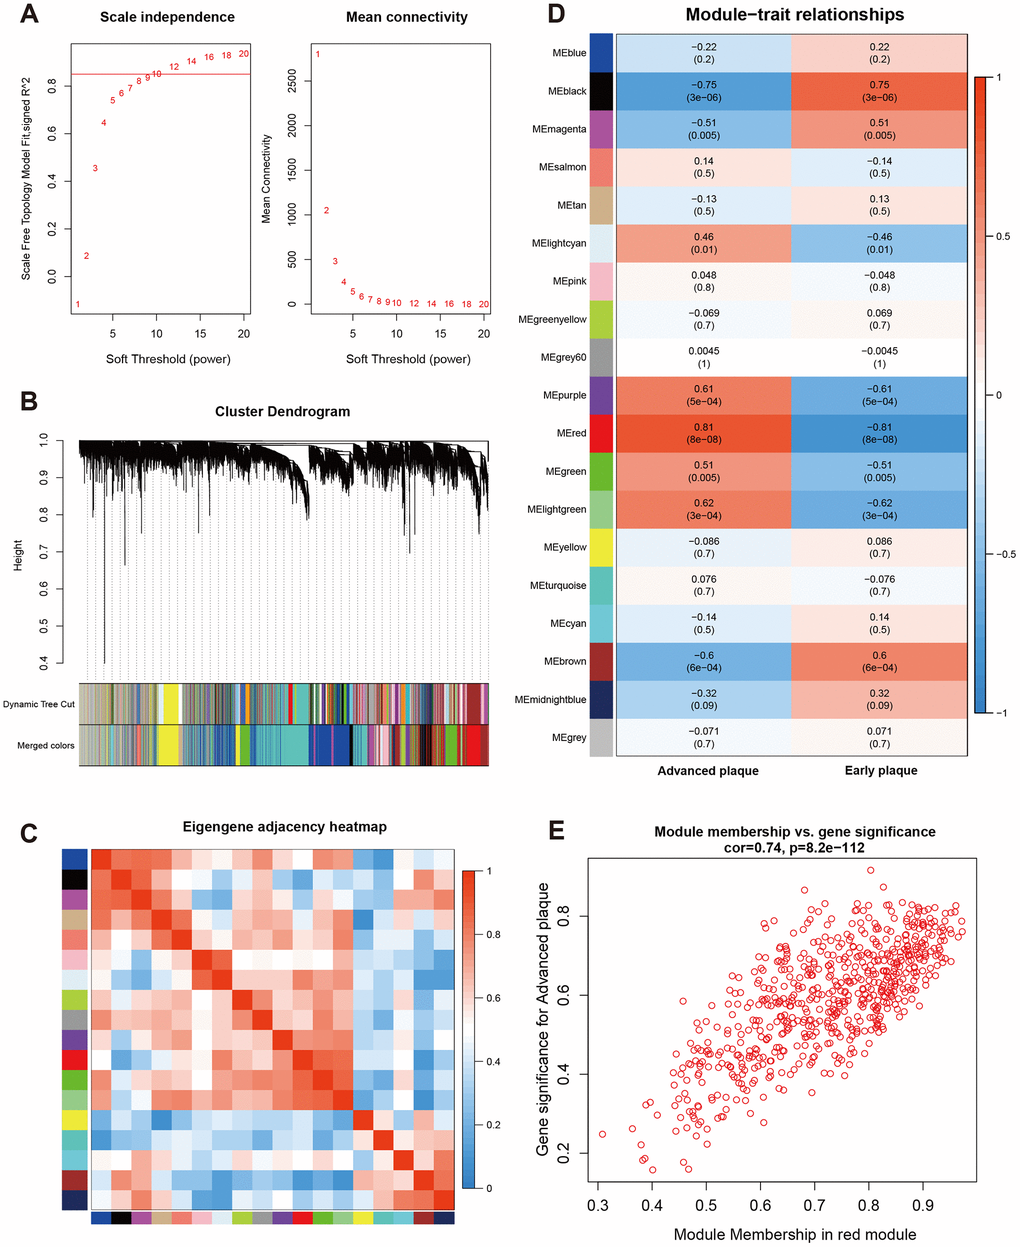
Figure 2.Construction of weighted co-expression network and module analysis. (A) Soft threshold selection process; (B) Cluster dendrogram. Each color represents one specific co-expression module. In the colored rows below the dendrogram, the two colored rows represent the original modules and merged modules; (C) Eigengene adjacency heatmap of different modules; (D) Heatmap of the correlation between status (advanced and early plaque) and module eigengenes. Each row corresponds to a module eigengene, and each column corresponds to a trait. Each cell contains the corresponding correlation (first line) and P-value (second line). The table is color-coded by correlation according to the color legend. P-value < 0.05 represents statistical significance; (E) Correlation between module membership of Red module and gene significance with advanced plaque (absolute value).