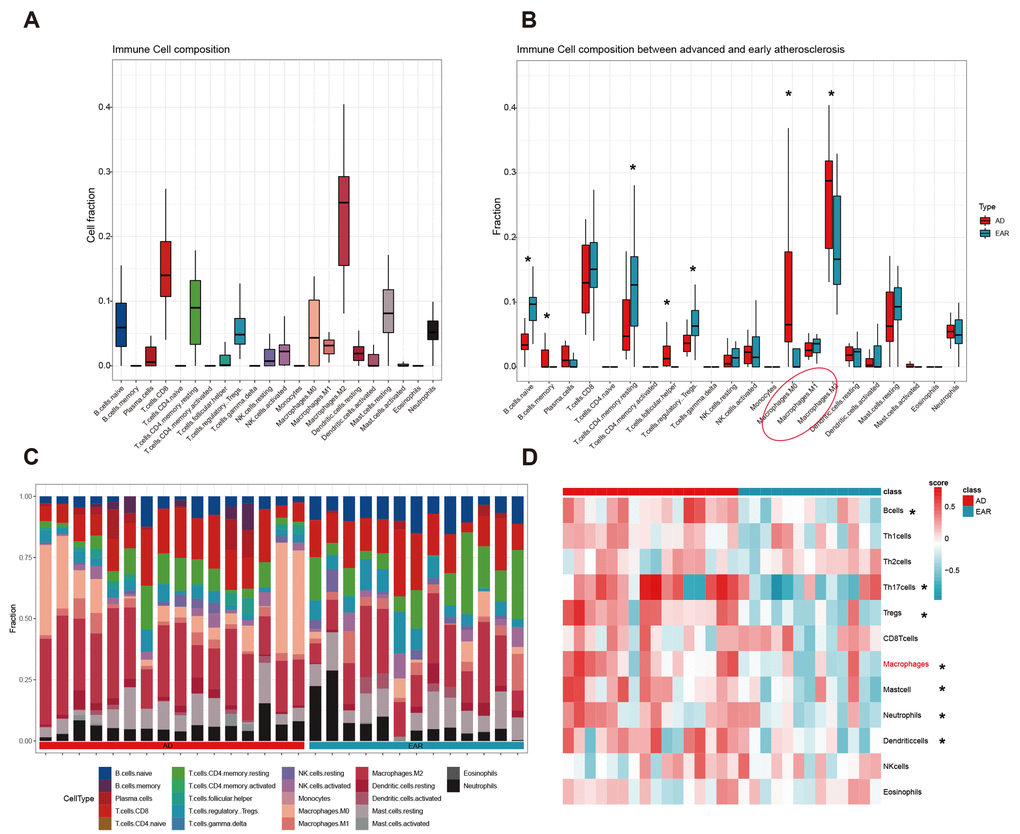
Figure 6.Immune cell infiltration analysis. (A) Cell composition analysis of the 29 plaque samples; (B) Grouped by type (advanced/early); (C) Scale histogram of immune cell fraction; (D) Heatmap of 12 immune cells GSVA score. * represents statistical significance.