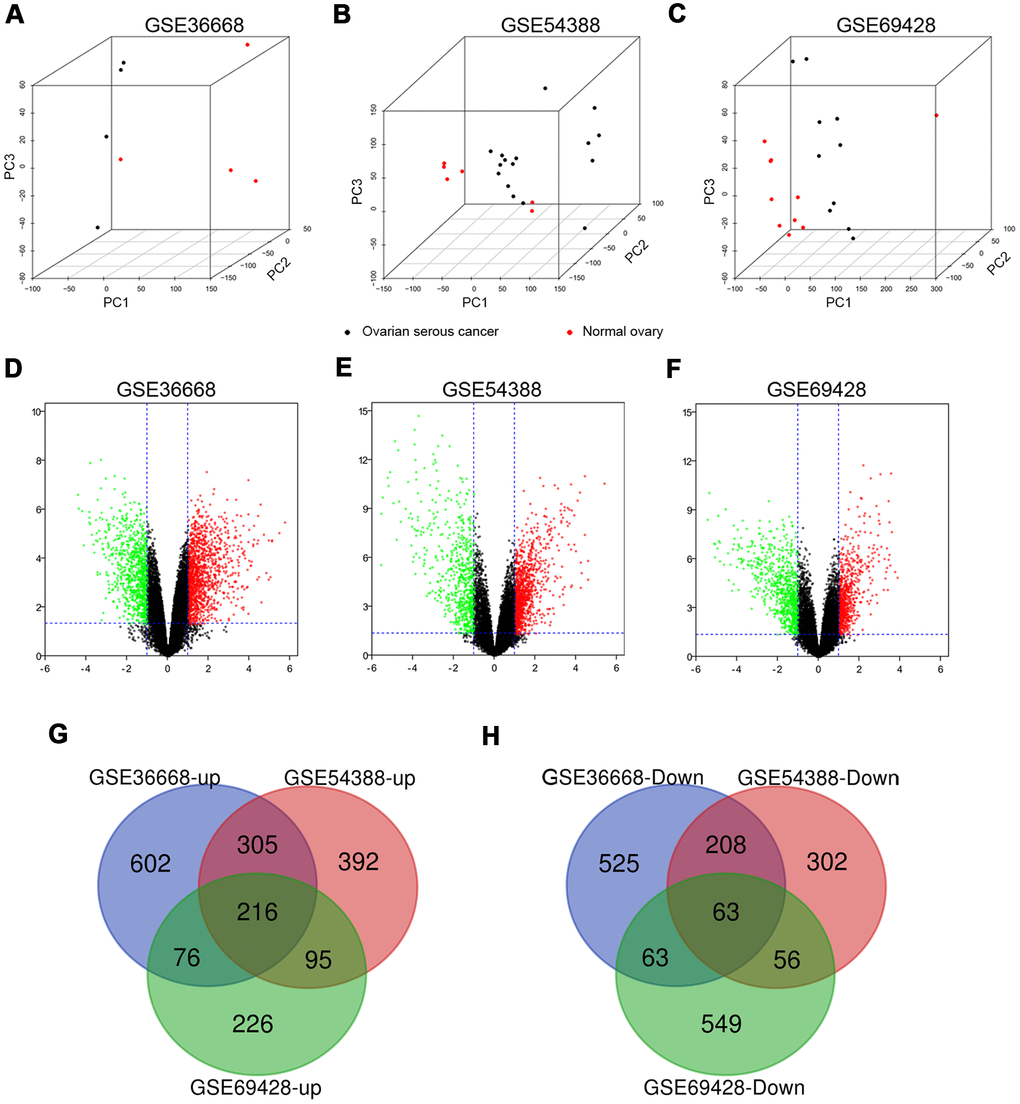
Figure 1.The distribution of expression situation and DEGs identification among GSE36668, GSE54388 and GSE69428 after normalization. (A–C) Whole transcriptomes were subjected to PCA on expressed genes to assess sample diversity and relatedness between OSC tissues (black dot) and normal ovary tissues (red dot). See also Supplementary Videos 1–3 (Supporting Information). (D, E) Volcano plots represent DEGs between OSC tissues and normal ovary tissues. Red dots indicate upregulation in DEG (LogFC≥1, p-value<0,05), and green dots indicate down regulation (LogFC≤-1, p-value<0.05). Three-way Venn diagram based on whole transcriptomes represents the distribution of the up expressed genes (G) and the down expressed genes (H) among these datasets.