Submit an Article
Navigate
Home
Editorial Board
Editorial Policies
Current Volume
Archive
Scientific Integrity
Publication Ethics Statements
Interviews with Outstanding Authors
Newsroom
Sponsored Conferences
Podcast
Contact
Special Collections
Submit an Article
Online ISSN: 1945-4589
Research Paper
|
Volume 13, Issue 2
|
pp. 1729–1741
Anserine, HClO-scavenger, protected against cognitive decline in individuals with mild cognitive impairment
Back to article
Figure 3
(3 of 5)
−
100%
+
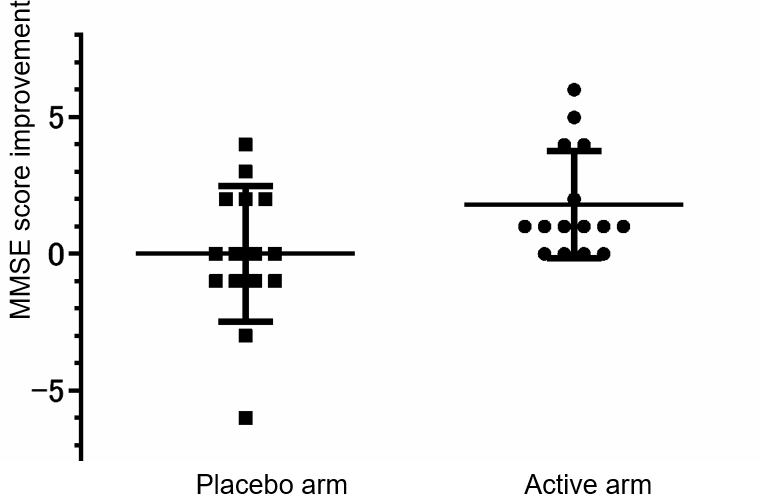
Figure 3.
The distribution of the MMSE scores change.
A dot shows the points of individual improvement. A bar shows the average in the placebo-administered subjects or the anserine-administered subjects and ± Standard Deviation.