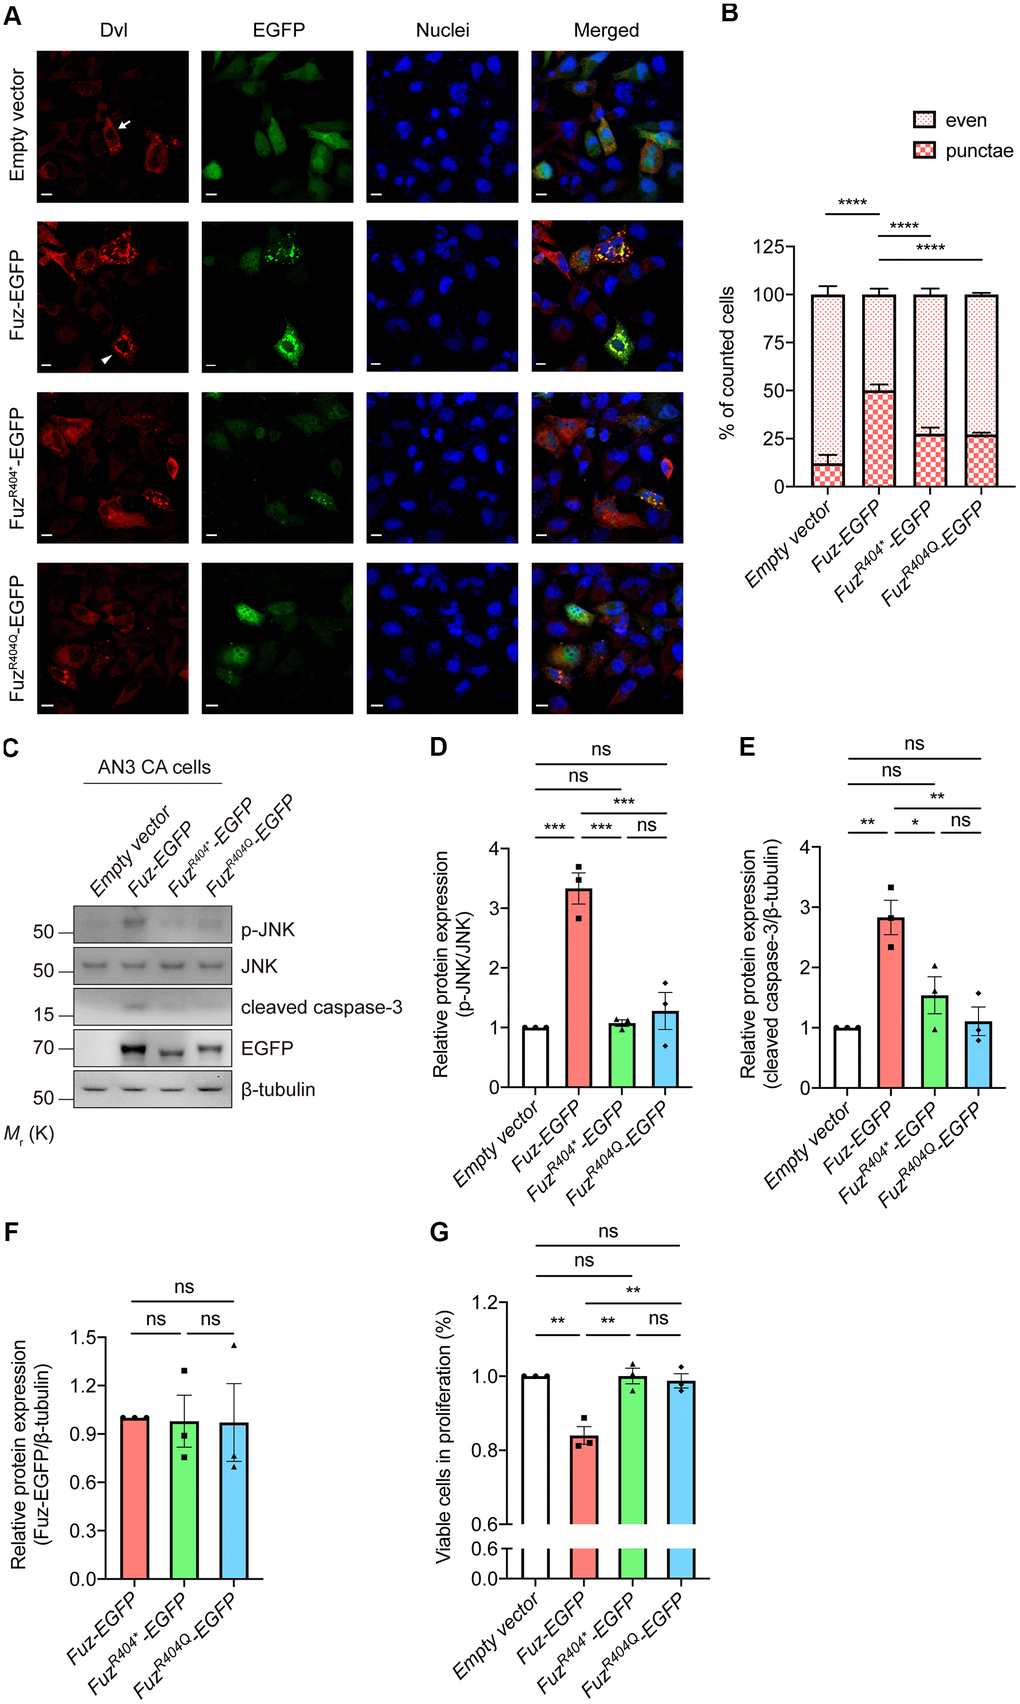
Figure 8.Overexpression of mutant Fuz proteins did not lead to the activation of cell apoptotic pathway. (A) When solely expressed in HEK293 cells, Dvl protein (red) showed two distinct staining patterns, which consist evenly distributed Dvl (arrow) and punctate Dvl (arrowhead). The evenly distributed Dvl is the predominant staining pattern. Overexpression of Fuz (green) promoted the formation of Dvl punctae, while such effect was attenuated in FuzR404* or FuzR404Q-expressing cells. Cell nuclei (blue) were stained with Hoechst 33342. Scale bars: 10 μm. n = 3 biological replicates. Each n represents an independent preparation of immunocytochemistry sample. At least 100 cells were counted in each control or experimental group from an independent experiment. (B) is the quantification of (A). Error bars represent S.E.M. Statistical analysis was performed using one-way ANOVA followed by post hoc Tukey’s test. **** denotes p < 0.0001. (C) Overexpression of Fuz, but not FuzR404* or FuzR404Q, promoted JNK-caspase-3 activation in HEK293 cells. n = 3 biological replicates. Each n represents an independent preparation of cell protein samples. (D–F) Quantification of p-JNK, cleaved caspase-3 and Fuz-EGFP protein expression in (C). Error bars represent S.E.M. Statistical analysis was performed using one-way ANOVA followed by post hoc Tukey’s test. ns denotes no significant difference, * denotes p < 0.05, ** denotes p < 0.01 and *** denotes p < 0.001. (G) Overexpression of Fuz, but not FuzR404* or FuzR404Q, suppressed the percentage of viable cells in proliferation. n = 3 biological replicates. Each n represents an independent preparation of cell proliferation assay samples. Error bars represent S.E.M. Statistical analysis was performed using one-way ANOVA followed by post hoc Tukey’s test. ns denotes no significant difference, ** denotes p < 0.01.