


Introduction
The planar cell polarity (PCP) pathway is an evolutionarily conserved signaling axis that organizes the polarized movements of cells within a planar plane to achieve tissue patterning and morphogenesis [1]. Initial studies on the molecular functions of PCP pathway emphasize the relationship between PCP signaling and mammalian embryonic development, as exemplified by the fact that genetic alterations in PCP genes lead to severe neurodevelopmental deficits [2–4]. In addition to developmental defects, the PCP pathway also takes part in human disorders, including Alzheimer’s disease [1] and cancer [5, 6].
Two subsets of genes, including PCP core and effector genes, contribute to the signal transduction of the PCP pathway [7]. It is generally accepted that PCP effectors function genetically downstream of PCP core genes [8]. However, a few studies also indicate that the cellular functions of PCP core proteins could be reversely influenced by the PCP effectors, suggesting a more complex regulatory network between PCP core and effector genes in PCP signaling [9–11]. Cancer describes a broad range of diseases characterized by sustained cell proliferation and metastasis triggered by cell invasion to nearby tissues and organs [12, 13]. Several key signaling pathways, including those essential for embryonic neurodevelopment, are reported to function during tumorigenesis as well [14–16]. This indicates that some molecular mechanisms in human neurological disorders and cancer could be mutually inclusive. Recent research further unveiled the role of PCP signaling in cancer malignancy [17] and cancer cell dissemination [18, 19]. Moreover, upregulation of PCP core gene expression, Prickle1 and Vangl2, inhibits neuroblastoma cell overproliferation, and corresponds to better survival probabilities in cancer patients [20].
Fuzzy planar cell polarity protein (Fuz) is categorized as a PCP effector. Similar to the other PCP core and effector players, the molecular function of Fuz was initially studied in mammalian embryonic development. The Fuz knockout (Fuz-/-) mice showed severe developmental retardation accompanied by the impairments in ciliogenesis and several essential developmental pathways, in particular, the Hedgehog signaling axis [10, 21]. At the cellular level, Fuz protein localizes to the basal body and ciliary axoneme to support cilia outgrowth [11]. Meanwhile, Fuz interacts to mediate the ciliary trafficking of Dishevelled (Dvl) protein, an intermediator responsible for signal transduction in Wnt pathways, suggesting a potential function of Fuz in Wnt signaling [11]. As observed in the embryonic fibroblasts isolated from Fuz-/- mice, canonical Wnt/β-catenin signaling pathway was hyperactivated as demonstrated by the accumulation of nuclear β-catenin protein [11]. The expression of a group of β-catenin-targeted genes was also shown to be upregulated, which in turn causes an enhanced cell proliferation in Fuz-/- mouse embryos [22]. In our previous study, we reported a novel pro-apoptotic function of the Fuz protein. When overexpressed, Fuz stimulates Dvl-Rac1-MAPK-caspase signaling cascade to trigger cell apoptosis [23]. Taken together, these findings support a crucial role of Fuz in mediating cell survival.
A previous study showed that overexpression of Fuz protein suppresses the growth of liver cancer cell line HEP1 in vitro, as well as in a mouse xenograft model [24]. Given the negative regulatory function of Fuz in controlling cell viability, we performed a pan-cancer survey to investigate the potential role of Fuz in multiple types of cancer. Fuz mRNA level was found downregulated in head-neck squamous cell carcinoma (HNSC) and lung adenocarcinoma (LUAD) tumor samples, and such downregulation contributes to a reduction of the overall survival probabilities in patients. Moreover, we demonstrated a tight correlation between Fuz transcription and Fuz DNA methylation level, and further showed that reduction of Fuz mRNA level in HNSC and LUAD tumor samples was achieved via hypermethylation of two independent CpG sites within Fuz promoter region. We also identified coding sequence alterations in the Fuz locus across different cancer types and highlighted a relatively higher mutation frequency at 404th arginine residue. Functional analyses demonstrated that the pro-apoptotic capability of mutant Fuz protein is attenuated. In summary, this study is the first report to provide an in-depth investigation of Fuz in multiple types of cancer, and further demonstrates the effects of Fuz promoter DNA methylation and coding sequence alterations in cancer.
Results
Investigation of prognostic value of Fuz in multiple cancer types
We initially used Kaplan-Meier plotter (https://kmplot.com/analysis/) to assess the prognostic significance of Fuz mRNA expression in 21 different types of cancer. As shown in the Kaplan-Meier curves, Fuz expression was found to be significantly associated with the overall survival (OS) of patients from 8 types of cancer (Figure 1). In liver hepatocellular carcinoma (LIHC) and stomach adenocarcinoma (STAD), increased Fuz transcript level was shown to have poor OS in patients. However, in the remaining 6 types, i.e. breast cancer (BRCA), esophageal adenocarcinoma (ESCA), head-neck squamous cell carcinoma (HNSC), kidney renal clear cell carcinoma (KIRC), kidney renal papillary cell carcinoma (KIRP) and lung adenocarcinoma (LUAD), a reduced expression of Fuz was expected to contribute to decreased survival probabilities (Figure 1). The prognostic significance of Fuz mRNA expression was further assessed in different subtypes of breast cancer. Reduced level of Fuz was found to be significantly associated with poor OS in luminal A and HER2+ breast cancer patients (Supplementary Figure 1A). In addition, the prognostic significance of Fuz in breast cancer (Supplementary Figure 1B), lung cancer (Supplementary Figure 1C) and gastric cancer (Supplementary Figure 1D) was further supported by additional Gene Expression Omnibus (GEO) datasets.
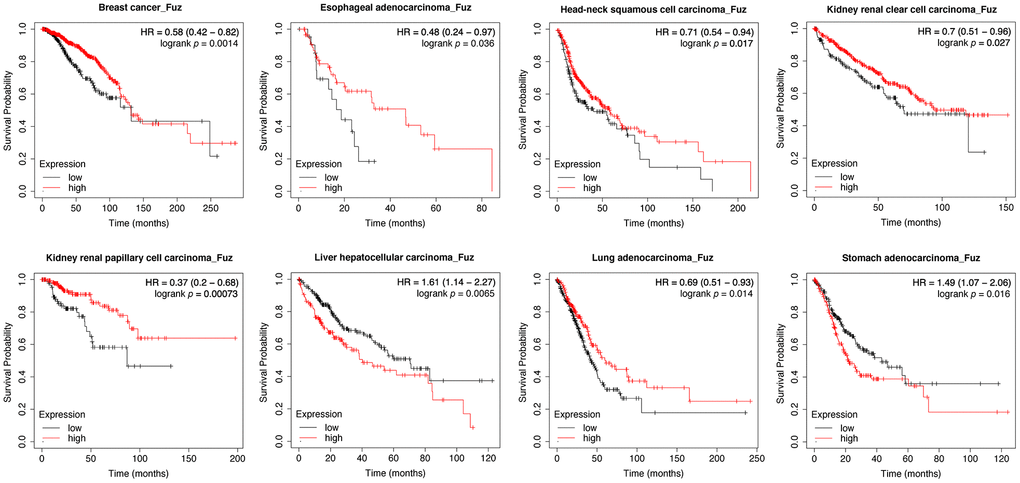
Figure 1. Evaluation of the prognostic significance of Fuz mRNA expression in different cancer types. Kaplan-Meier pan-cancer survival analysis was performed to evaluate the relationship between Fuz mRNA level and overall survival probabilities in 21 different types of cancer. Low level of Fuz expression was found associated with poor prognosis in BRCA, ESCA, HNSC, KIRC, KIRP and LUAD patients, whilst high level of Fuz expression was found associated with poor prognosis in LIHC and STAD patients.
The expression level of Fuz, together with other clinicopathological variables (gender, race, ethnicity, primary diagnosis, tumor stage, age at diagnosis), were analyzed and included in multivariate statistics. As summarized in Supplementary Table 1, decreased level of Fuz was an independent predictor of worse OS of BRCA (HR, 0.9996; 95% Cl, 0.9993-1.000; p value, 0.0106) and KIRP (HR, 0.9988; 95% Cl, 0.9981-1.000; p value, 0.00241) patients, whereas high expression of Fuz was independently associated with worse OS of STAD (HR, 1.001; 95% Cl, 1.0002-1.001; p value, 0.00257) patients.
Examination of Fuz transcript level in multiple cancer types
Based on our patient survival analysis (Figure 1 and Supplementary Figure 1), we next determined if Fuz mRNA expression was altered in primary tumor tissues. Transcriptomic profiling data mining from The Cancer Genome Atlas (TCGA) data set repository (https://portal.gdc.cancer.gov/repository) was used to evaluate Fuz mRNA level in all primary tumor and solid normal tissues. Moreover, paired samples, with each pair comprises tumor and adjacent non-tumor samples from the same patient, were also included to provide more convincing evaluation of Fuz mRNA alterations. In HNSC (Figure 2A, 2B), LUAD (Figure 2E, 2F), LIHC (Supplementary Figure 2E) and STAD (Supplementary Figure 2F), Fuz expression was significantly downregulated in primary tumor tissues, and such downregulation was further observed in their paired samples. Downregulation of Fuz in HNSC (Figure 2C, 2D), LUAD (Figure 2G) and LIHC (Supplementary Figure 3) tumor samples was further validated in additional GEO datasets. In BRCA, although Fuz expression was found significantly altered in primary tumor tissues, no significant alteration was identified between tumor and paired non-tumor samples (Supplementary Figure 2A). No significant change in Fuz expression was observed in ESCA (Supplementary Figure 2B), KIRC (Supplementary Figure 2C) and KIRP (Supplementary Figure 2D) patient samples.
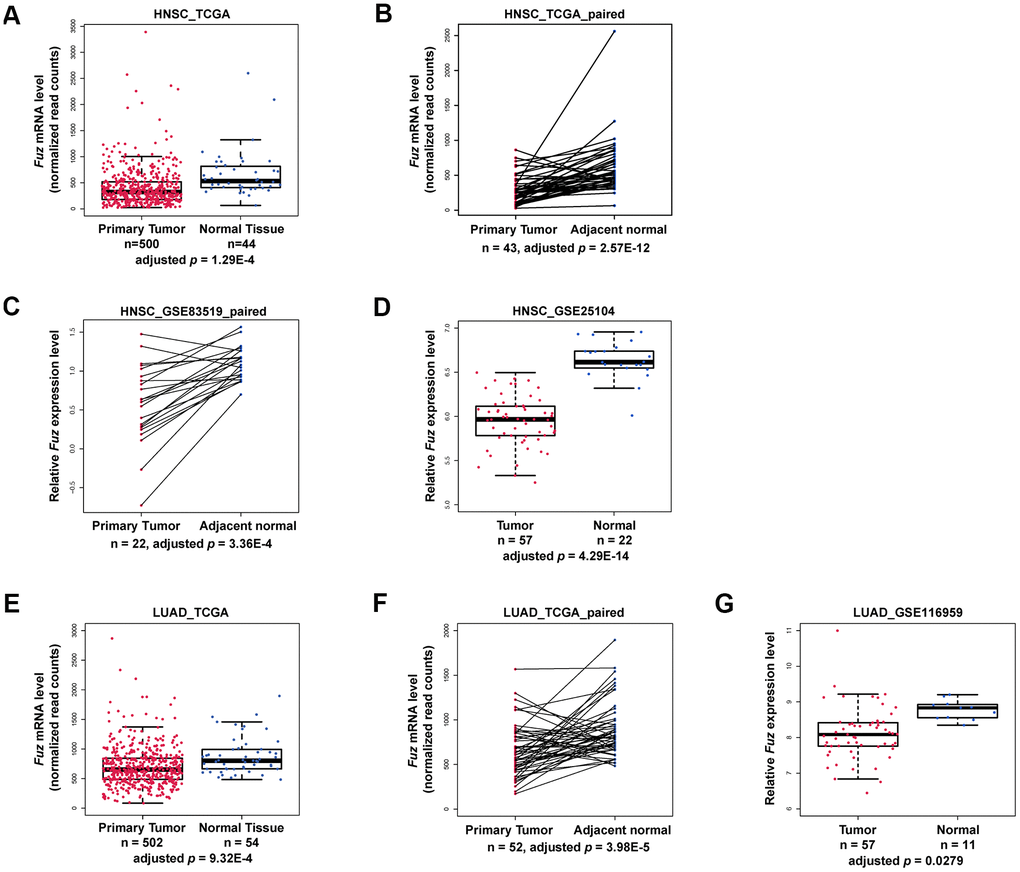
Figure 2. Fuz mRNA level was downregulated in HNSC and LUAD patients. (A–D) The expression of Fuz was found significantly downregulated in tumor tissues from HNSC patients. The datasets used for analysis were from TCGA, TCGA paired samples, GSE83519 and GSE25104, respectively. (E–G) The expression of Fuz was found significantly downregulated in tumor tissues from LUAD patients. The datasets used for analysis were from TCGA, TCGA paired samples and GSE116959.
In line with our survival analysis, lowered expression of Fuz detected in HNSC and LUAD tumor samples (Figure 2) coincides with poor OS in patients (Figure 1). We thus decided to focus on HNSC and LUAD in our subsequent studies.
Gene set enrichment analysis of genes from HNSC tumor samples with low Fuz expression
All primary tumor tissues with available patient survival information (n = 498) were divided into high Fuz expression group (n = 409) and low Fuz expression group (n = 89) according to the survival probabilities of HNSC patients. The low Fuz expression group showed poor OS in HNSC (Figure 3A). To gain further insight into the gene expression features in the low Fuz expression group, differential gene expression analysis was performed between low Fuz expression and high Fuz expression groups (Supplementary File 1). The log2FC and adjusted p < 0.001 were used as selection criteria to determine upregulated (787 genes) and downregulated (4,748 genes) gene sets (Figure 3B). We then investigated whether these dysregulated genes are enriched in certain signaling pathways. GSEAPreranked analysis was performed to determine significantly enriched GO terms and Reactome pathways. Compared to the enriched GO terms (15 items) in the downregulated gene set, more (26 items) were found in the upregulated gene set (Figure 3C, 3D). Meanwhile, the Reactome pathway analysis demonstrated 5 enriched downregulated pathways and 27 enriched upregulated pathways (Figure 3E, 3F). We further selected the top 500 dysregulated genes based on the |log2FC| to construct a protein-protein interaction (PPI) network by using the STRING database (https://string-db.org/). The network was visualized using Cytoscape and the densely connected MCODE network was isolated. The MCODE network was consisted of 16 genes, which were found enriched in muscle development, organization and contraction (Figure 3G).
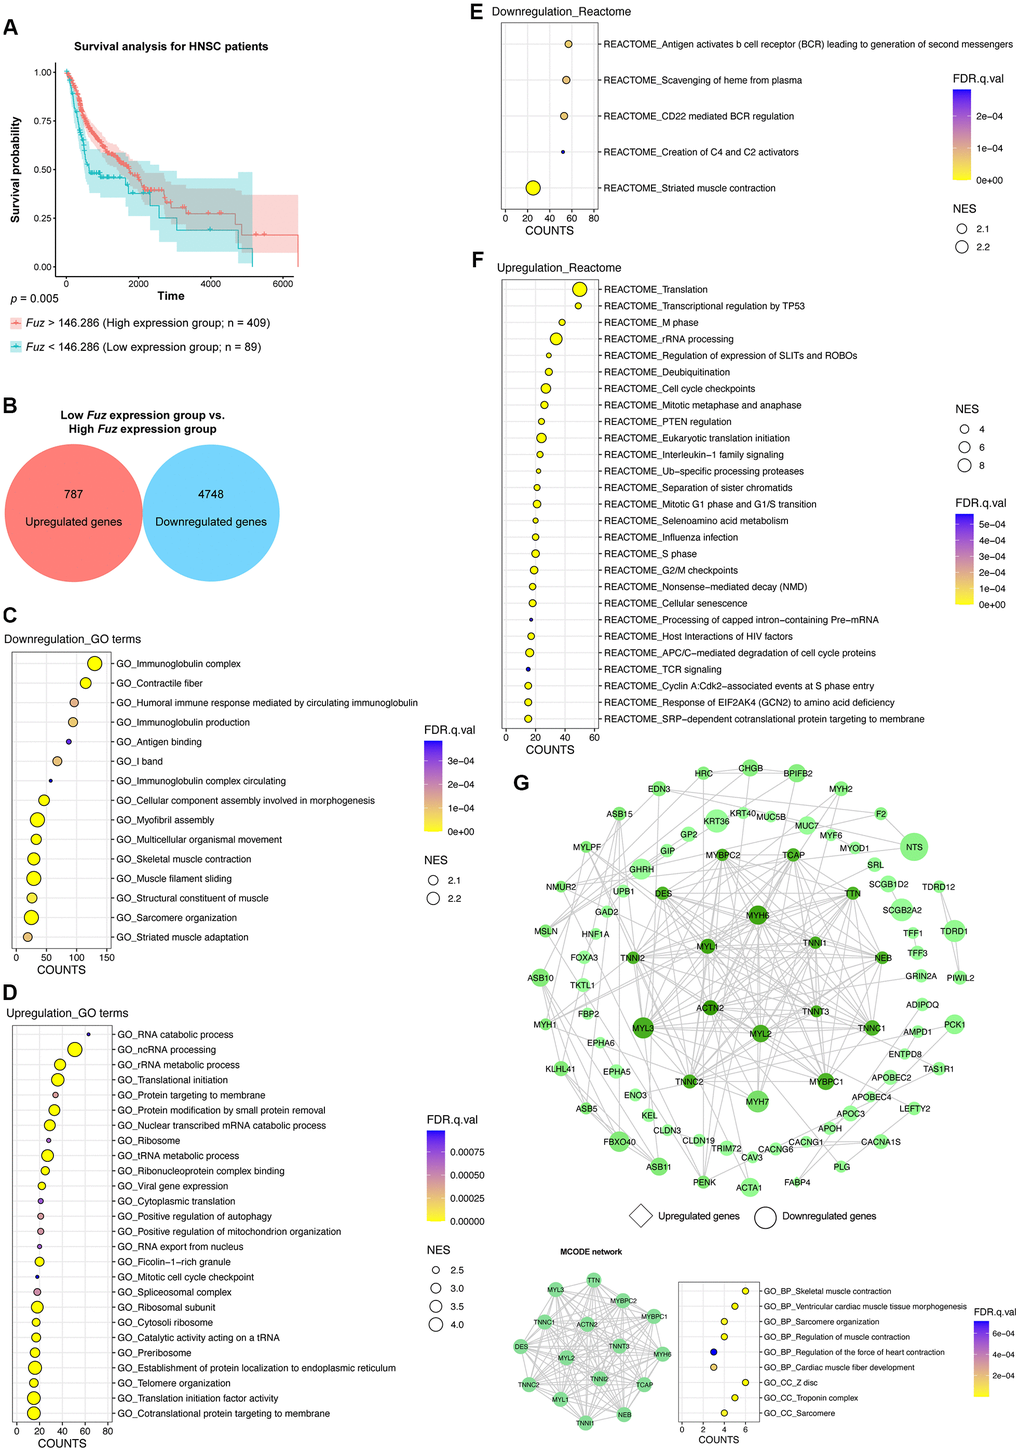
Figure 3. The gene set enrichment and PPI analyses of dysregulated genes from HNSC tumor samples with low Fuz expression. (A) The HNSC primary tumor tissues were divided into high Fuz expression and low Fuz expression groups based on the patient survival probabilities. (B) The number of upregulated and downregulated genes were calculated from HNSC primary tumor tissues with low Fuz expression. (C, D) The GO enrichment analysis demonstrated downregulated (C) and upregulated (D) genes-associated gene ontology terms in low Fuz expression group. (E, F) The Reactome pathway enrichment analysis demonstrated the downregulated (E) and upregulated (F) Reactome pathways in low Fuz expression group. (G) Protein-protein interaction analysis showed the interaction between upregulated genes (in diamond shape) and downregulated genes (in circular shape) from low Fuz expression group. The increasing degree of nodes was indicated by continuous color (light green-dark green). The size of nodes represents fold changes of gene expression. The densely connected network was isolated using MCODE function from Cytoscape. Genes from MCODE component were annotated for GO terms with DAVID v6.8.
Gene set enrichment analysis of genes from LUAD tumor samples with low Fuz expression
Similar to HNSC tumor samples (Figure 3A), we divided all LUAD primary tumor tissues with available patient survival information (n = 489) into high Fuz expression group (n = 187) and low Fuz expression group (n = 302). Poor OS in LUAD patients was observed in low Fuz expression group (Figure 4A). We then performed differential gene expression analysis between low and high Fuz expression groups (Supplementary File 1). The log2FC and adjusted p < 0.001 were used to select upregulated (987 genes) and downregulated (2,924 genes) gene sets in the low Fuz expression group (Figure 4B). The ranked gene set was submitted to GSEAPreranked for the subsequent enrichment analysis. Similar to what was observed in HNSC samples, more GO terms were enriched in upregulated gene set (25 items) compared to the downregulated one (10 items) (Figure 4C, 4D). The Reactome pathway analysis identified 13 enriched upregulated pathways (Figure 4E). The top 500 dysregulated genes were selected based on the |log2FC| for the following PPI network construction. The obtained PPI network from STRING database was visualized in Cytoscape software. The isolated MCODE network is composed of small proline-rich protein 1B (SPRR1B), small proline-rich protein 2D (SPRR2D), small proline-rich protein 2E (SPRR2E), small proline-rich protein 2F (SPRR2F) and small proline-rich protein 2G (SPRR2G), which are involved in Keratinization and Peptide cross-linking (Figure 4F).
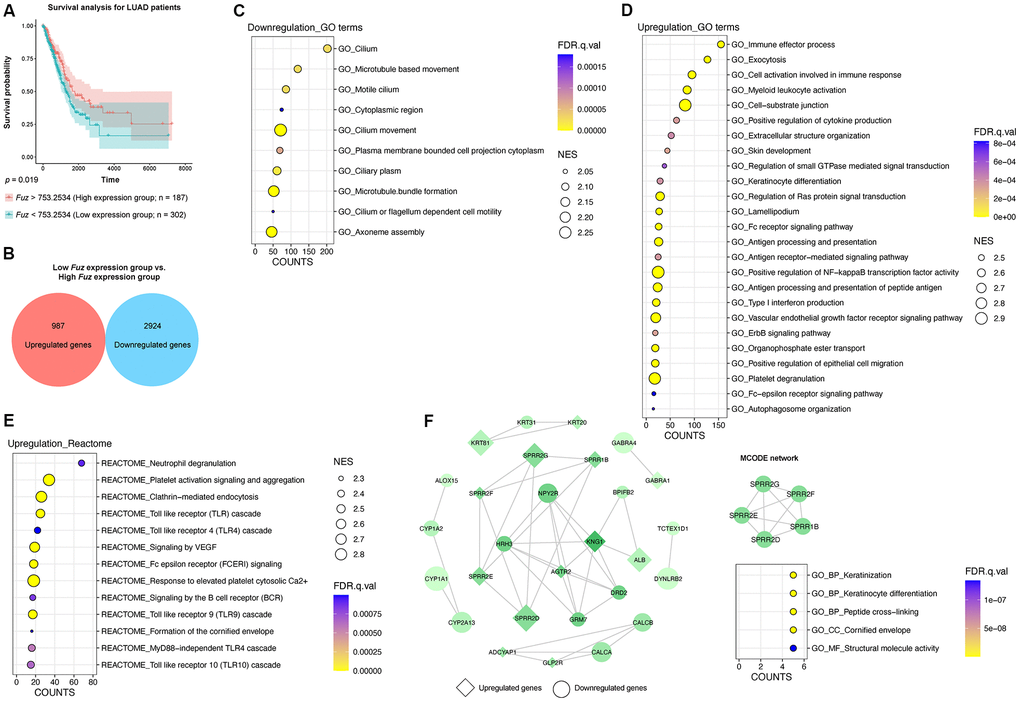
Figure 4. The gene set enrichment and PPI analyses of dysregulated genes from LUAD tumor samples with low Fuz expression. (A) The LUAD primary tumor tissues were divided into high Fuz expression and low Fuz expression groups based on the patient survival probabilities. (B) The number of upregulated and downregulated genes were calculated from LUAD primary tumor tissues with low Fuz expression. (C, D) The GO enrichment analysis demonstrated downregulated (C) and upregulated (D) genes-associated gene ontology terms in low Fuz expression group. (E) The Reactome pathway enrichment analysis demonstrated the upregulated Reactome pathways in low Fuz expression group. (F) Protein-protein interaction analysis showed the interaction between upregulated genes (in diamond shape) and downregulated genes (in circular shape) from low Fuz expression group. The increasing degree of nodes was indicated by continuous color (light green-dark green). The size of nodes represents fold changes of gene expression. The densely connected network was isolated using MCODE function from Cytoscape. Genes from MCODE component were annotated for GO terms with DAVID v6.8.
Fuz promoter methylation is responsible for Fuz transcriptional downregulation in ESCA, HNSC and LUAD tumor samples
DNA methylation is one of the essential epigenetic regulators of gene expression [25]. Given that DNA methylation in gene promoter negatively controls gene transcription, we investigated whether the aberrant Fuz transcription is associated with alteration of Fuz promoter methylation in different types of cancer (Supplementary File 2). As shown in Figure 5A, 3 independent CpG methylation sites, cg11398523, cg21712019 and cg22708738, were identified within or close to a predicted CpG island in the Fuz promoter (Fuz+117/+347CpG) [23]. The DNA methylation levels at sites cg11398523 and cg22708738 were found negatively associated with Fuz expression in multiple types of cancer, including ESCA, HNSC and LUAD (Figure 5A). The mRNA expression and DNA methylation data obtained from TCGA further confirmed an inverse correlation between Fuz expression and its DNA methylation level in ESCA, HNSC and LUAD primary tumor tissues (Figure 5B–5D). Moreover, upon treatment of 5-Azacytidine, inhibitor of DNA methyltransferase, Fuz expression was upregulated in cell lines from esophageal carcinoma (Figure 5E) and lung adenocarcinoma (Figure 5F).
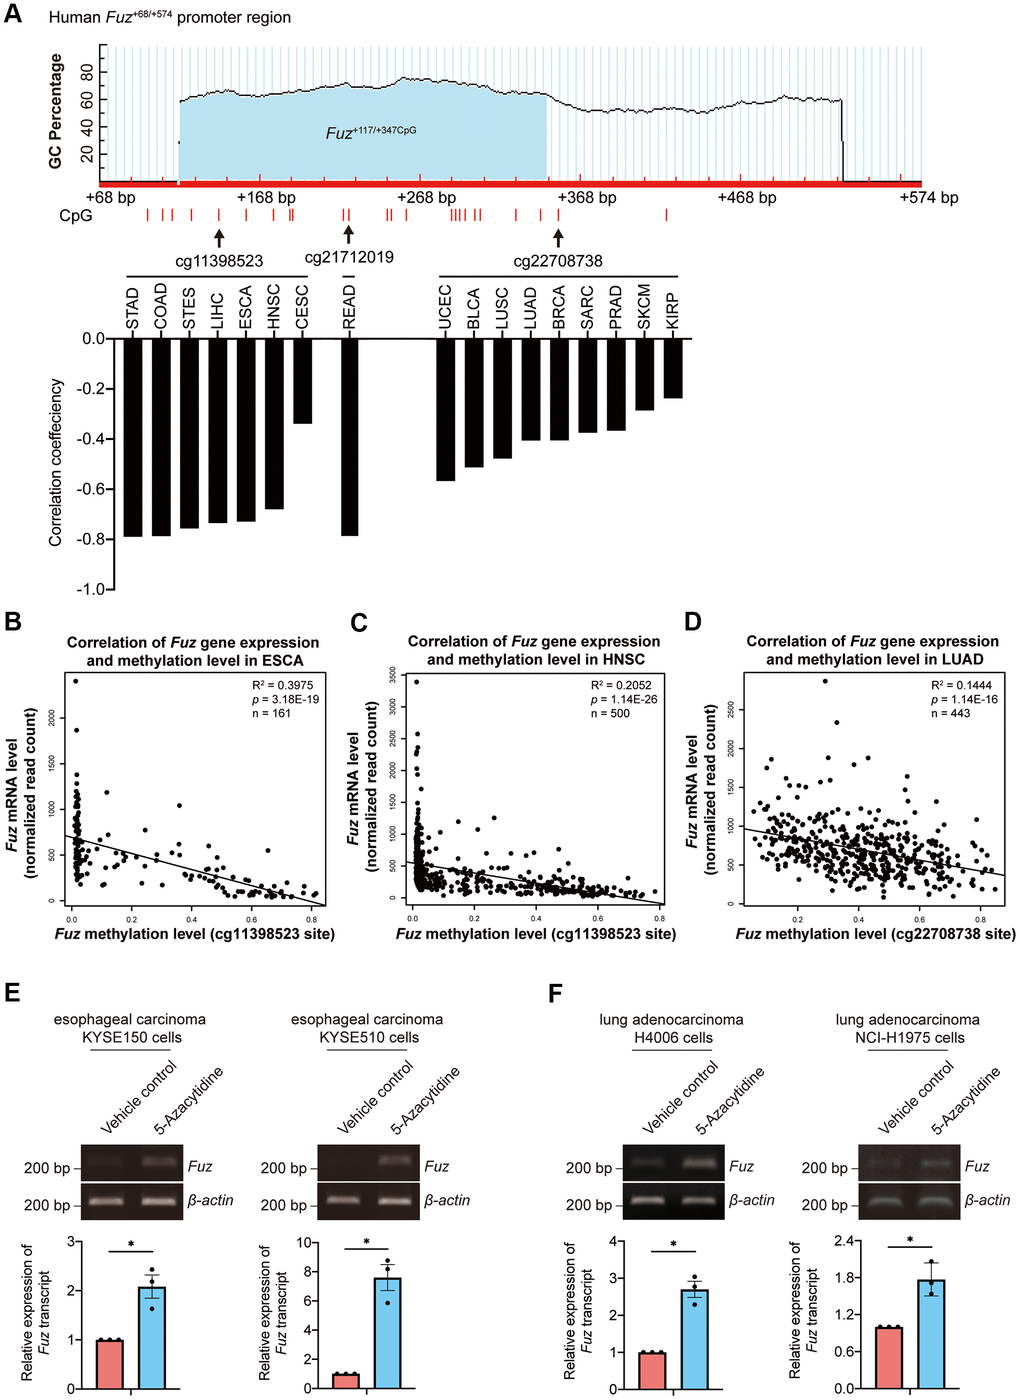
Figure 5. Fuz expression was associated with its promoter methylation level in ESCA and LUAD tumor samples. (A) Fuz methylation data obtained from Firebrowse database indicates that Fuz mRNA level was negatively associated with its promoter methylation level in various types of cancer. Three methylation sites (cg11398523, cg21712019 and cg22708738) were highlighted, and these sites reside within or close to a potential CpG island (Fuz+117/+347CpG) in Fuz+68/+574 promoter region. The CpG island Fuz+117/+347CpG was predicted using MethPrimer software (https://www.urogene.org/cgi-bin/methprimer/methprimer.cgi) [27]. (B, C) Fuz mRNA level negatively correlates with the methylation at cg11398523 site within Fuz promoter in ESCA (B) and HNSC (C) patient samples. (D) A negative correlation between Fuz expression and Fuz promoter methylation level (at cg22708738 site) was identified in LUAD patient samples. (E) Treatment of 5-Azacytidine upregulated Fuz transcript level in esophageal carcinoma KYSE150 and KYSE510 cell lines. (F) Fuz transcript level was increased upon treatment of 5-Azacytidine in lung adenocarcinoma H4006 and NCI-H1975 cell lines. n = 3 biological replicates. Each n represents an independent preparation of cell RNA samples. Error bars represent S.E.M.. Statistical analysis was performed using two-tailed unpaired Student’s t-test. * denotes p < 0.05.
We found that high Fuz DNA methylation at site cg11398523 and cg22708738 leads to reduced survival probabilities in HNSC and LUAD patients, respectively (Figure 6B, 6C). These coincide with our findings that lowered Fuz expression contributes to poor OS in HNSC and LUAD patients (Figures 3A, 4A). Meanwhile, lowered expression of Fuz was found associated with poor OS in ESCA patients (Supplementary Figure 4). Although a tendency of high Fuz DNA methylation level at site cg11398523 was observed in ESCA patients with poor OS, the difference in survival probabilities between high and low Fuz DNA methylation groups was not statistically significant (Figure 6A). We further compared Fuz DNA methylation levels between ESCA, HNSC and LUAD primary tumor tissues and their respective normal controls. As shown in Figure 6D–6F, a significant upregulation of Fuz DNA methylation level was detected in ESCA, HNSC and LUAD tumor samples. Taken together, these findings demonstrate a negative correlation between Fuz mRNA expression and Fuz DNA methylation level, and further suggest that Fuz promoter hypermethylation is a contributor to its transcriptional downregulation in ESCA, HNSC and LUAD.
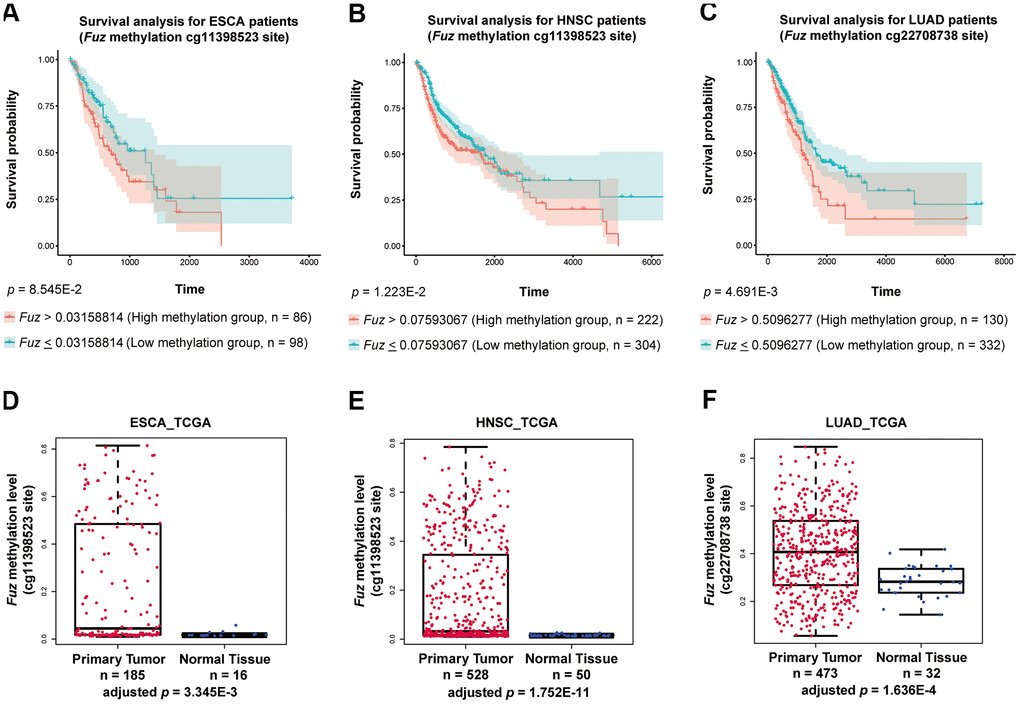
Figure 6. High methylation of Fuz promoter associated with poor survival probabilities in HNSC and LUAD patients, and Fuz promoter methylation level was significantly upregulated in tumor samples from ESCA, HNSC and LUAD patients. (A) Difference in Fuz promoter methylation level did not cause a significant alteration of survival probability in ESCA patients. (B, C) High Fuz promoter methylation leads to poor overall survival in HNSC (B) and LUAD (C) patients. (D, E) The methylation level of Fuz at cg11398523 site was significantly upregulated in ESCA (D) and HNSC (E) patient tumor samples. (F) The methylation level of Fuz at cg22708738 site was significantly upregulated in LUAD patient tumor samples.
Identification of Fuz coding sequence alterations in multiple cancer types
In addition to gene dysregulation, coding sequence alteration is another pathogenic hallmark of cancer [26]. The mutant gene product generated may confer gain- or loss-of-function and affect outputs of cancer-related pathways.
We thus explored if potential coding region variations in the Fuz gene exist in cancer genomes. The alteration frequency of Fuz was examined across 32 independent TCGA PanCancer Atlas Studies using the cBioPortal database (https://www.cbioportal.org/). Several kinds of genetic alterations, including mutation, fusion, amplification and deep deletion in the Fuz gene were uncovered from various cancer types, with the highest alteration frequency found in endometrial carcinoma samples (Figure 7A, Supplementary Table 2). Interestingly, a relatively higher mutation frequency at the 404th amino acid position of the Fuz protein (FuzR404) was identified (Figure 7B). The FuzR404 arginine residue was found mutated in 4 tumor samples from bladder urothelial carcinoma, colorectal adenocarcinoma and uterine corpus endometrial carcinoma, and all these 4 mutated samples were caused by the single nucleotide substitution (Figure 7C). However, the missense mutation (c.G1211A) leads to a replacement of the arginine with glutamine (p.R404Q), whereas the nonsense mutation (c.C1210T) generates a truncated gene product (p.R404*; Figure 5C).
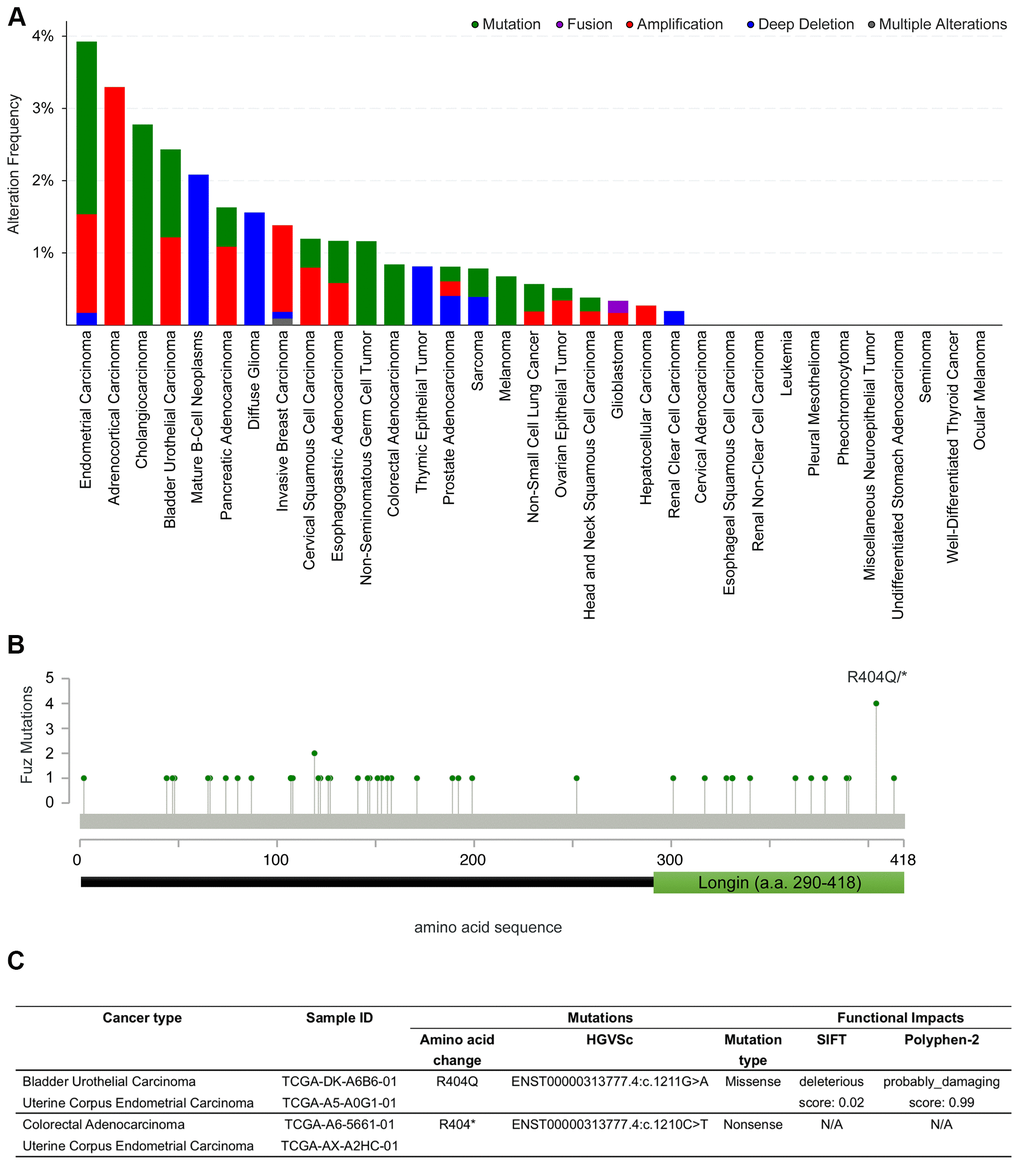
Figure 7. Coding sequence alterations in Fuz were identified across multiple cancer types. (A) cBioportal online database was used to investigate Fuz coding sequence alterations in multiples types of cancer. (B) A relative higher mutation frequency was identified at the 404th arginine residue within the coding sequence at Fuz locus. (C) The missense and nonsense mutations at FuzR404 were identified in 4 patient samples from 3 independent studies.
Investigation of the functional consequence of mutant Fuz protein
We previously showed a novel pro-apoptotic function of Fuz protein, however, whether mutant FuzR404Q would affect the activation of cell apoptotic pathway remains elusive. We thus examined the pro-apoptotic property of mutant Fuz protein.
The mutant Fuz expression construct harboring R404* or R404Q mutation was generated (Supplementary Figure 5). Fuz was reported to trigger cell apoptosis via activating Dvl-Rac1-MAPK-caspase-3 signaling axis [23]. We then tested the activity of this apoptotic pathway in FuzR404* or FuzR404Q-expressing cells. When overexpressed in our HEK293 cell model, the wildtype Fuz protein activates Dvl protein aggregation (from 12.22% to 50.17%), whereas such activation was attenuated in FuzR404* (27.57%) or FuzR404Q (27.18%) overexpression cells (Figure 8A, 8B). Moreover, although expressed at comparable levels, the JNK-caspase-3 activation triggered by wildtype Fuz protein was found mitigated in FuzR404* or FuzR404Q-expressing cells (Figure 8C–8F). In addition, the Fuz-mediated suppression of cell proliferation was alleviated in FuzR404* or FuzR404Q overexpression cells (Figure 8G). Taken together, these functional experiments suggest that mutation at 404th arginine residue perturbs the biological function of Fuz in triggering apoptosis.
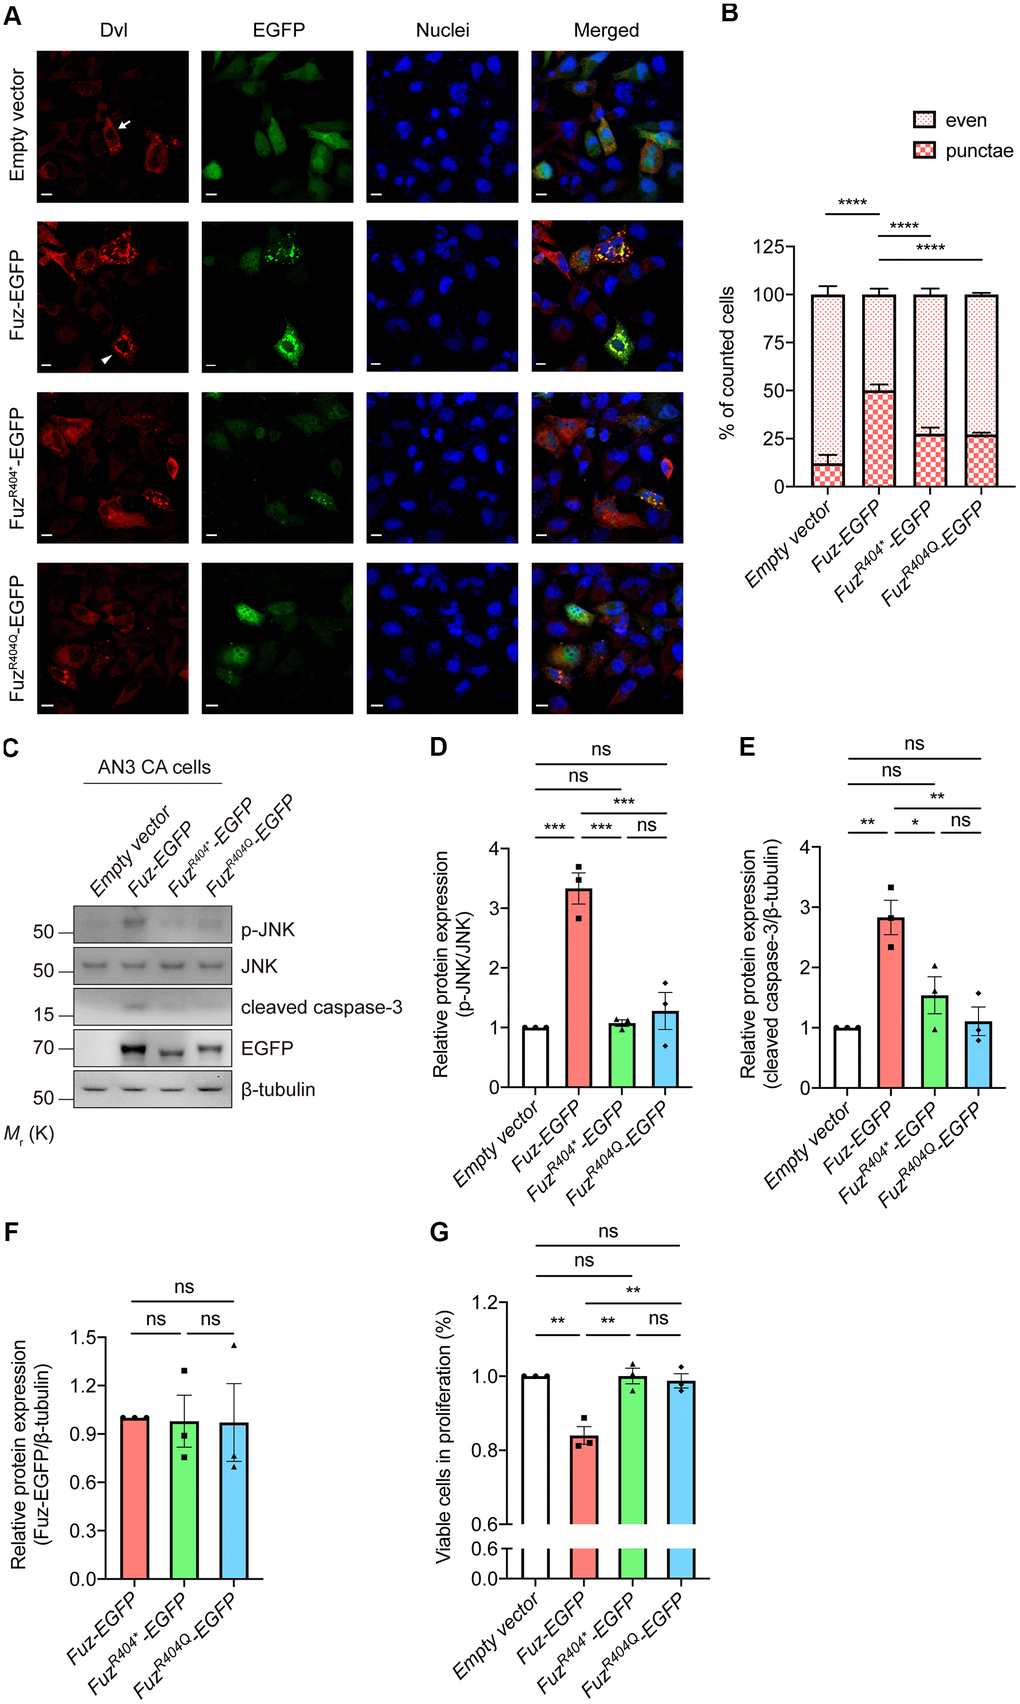
Figure 8. Overexpression of mutant Fuz proteins did not lead to the activation of cell apoptotic pathway. (A) When solely expressed in HEK293 cells, Dvl protein (red) showed two distinct staining patterns, which consist evenly distributed Dvl (arrow) and punctate Dvl (arrowhead). The evenly distributed Dvl is the predominant staining pattern. Overexpression of Fuz (green) promoted the formation of Dvl punctae, while such effect was attenuated in FuzR404* or FuzR404Q-expressing cells. Cell nuclei (blue) were stained with Hoechst 33342. Scale bars: 10 μm. n = 3 biological replicates. Each n represents an independent preparation of immunocytochemistry sample. At least 100 cells were counted in each control or experimental group from an independent experiment. (B) is the quantification of (A). Error bars represent S.E.M. Statistical analysis was performed using one-way ANOVA followed by post hoc Tukey’s test. **** denotes p < 0.0001. (C) Overexpression of Fuz, but not FuzR404* or FuzR404Q, promoted JNK-caspase-3 activation in HEK293 cells. n = 3 biological replicates. Each n represents an independent preparation of cell protein samples. (D–F) Quantification of p-JNK, cleaved caspase-3 and Fuz-EGFP protein expression in (C). Error bars represent S.E.M. Statistical analysis was performed using one-way ANOVA followed by post hoc Tukey’s test. ns denotes no significant difference, * denotes p < 0.05, ** denotes p < 0.01 and *** denotes p < 0.001. (G) Overexpression of Fuz, but not FuzR404* or FuzR404Q, suppressed the percentage of viable cells in proliferation. n = 3 biological replicates. Each n represents an independent preparation of cell proliferation assay samples. Error bars represent S.E.M. Statistical analysis was performed using one-way ANOVA followed by post hoc Tukey’s test. ns denotes no significant difference, ** denotes p < 0.01.
Discussion
Fuz is one of the PCP effectors that have been implicated in governing mammalian embryonic development [10, 21]. In addition to Fuz, Inturned and WDPCP are the other two PCP effector players. Unlike Inturned and WDPCP, which have been linked to different types of cancer [28–30], the study of Fuz in cancer remains under-investigated. In the current study, we uncovered that Fuz expression associates with patient survival probabilities in 8 types of cancer (Figure 1). In HNSC and LUAD, Fuz expression is reduced (Figure 2), and such reduction correlates with the poor survival probabilities in patients (Figures 3A, 4A). Interestingly, physical interactions have been demonstrated among PCP effectors, and their subcellular localization can be mutually modulated in Drosophila wing cells [9, 31]. Further investigations to consider Fuz, Inturned and WDPCP as a functional group could unveil more pathogenic details of PCP effectors in cancer.
Head and neck cancer and lung cancer are both the leading causes of cancer-associated mortality worldwide [32, 33]. As one of the key pathogenic features, gene dysregulation leads to dysfunctions of essential signaling pathways, which in turn contribute to cancer development and progression [34]. In this study, a GSEA approach was exploited to investigate enriched gene functions and pathways in HNSC and LUAD patients with poor OS (Figures 3, 4). In HNSC, the genes related to muscle contraction and immunoglobulin production and circulation were downregulated, whereas the upregulated genes were enriched in RNA processing and protein synthesis and modification (Figure 3C, 3D). Meanwhile, the Reactome pathway analysis highlights the enrichment of several cancer-related pathways, including mitotic metaphase and anaphase [35], cell cycle checkpoints [36] and transcriptional regulation by TP53 [37] (Figure 3F). Pharmacological inhibition of key factors related to cell cycle regulation, such as WEE1 G2 checkpoint kinase and checkpoint kinase 1, has been shown to force the HNSC cells skipping the cell cycle checkpoints, leading to accumulation of massive DNA damage and eventually cell death [38, 39]. Somatic mutation in TP53 is one of the most frequent genetic alterations among human cancers, including HNSC [40]. The variable TP53 mutational landscape in HNSC bears distinct activities of downstream pathological pathways, and mutant p53 dysregulates a range of oncogenic molecules in favor of malignant phenotype in HNSC cells [41–43]. In line with previous reports, our findings further emphasize the importance of cell cycle regulation and TP53 signaling in HNSC. In LUAD, the upregulated genes were enriched in immune response and exocytosis (Figure 4D). The Reactome pathway enrichment results further point out upregulation of several toll like receptor cascades, which are crucial for executing innate immune response (Figure 4E). Meanwhile, genes focusing on cilium organization were downregulated (Figure 4C). Interestingly, the histological examination of lung tumor samples reveals loss of ciliary structures, and the cilia-related gene expression was found markedly decreased [44, 45]. Moreover, stimulation of ciliogenesis combats against invasion, cell proliferation and epithelial-mesenchymal transition of lung cancer cells [46]. Given the role of PCP signaling in mediating ciliogenesis, our study further suggests the pathological significance of cilia biogenesis in LUAD.
Fuz transcription negatively correlates with its promoter DNA methylation level. When the human embryonic 293 cells are treated with 5-Azacytidine, a DNA methyltransferase inhibitor, Fuz mRNA level is found upregulated [23]. In our previous study, a putative CpG island within Fuz promoter, Fuz+117/+347CpG, was identified. We further reported that a transcriptional factor, YY1, maintains the methylation of Fuz+117/+347CpG to achieve the transcriptional repression of Fuz expression [23]. In this study, we further showed that DNA methylation of three independent CpG sites negatively correlates with Fuz mRNA level (Figure 5A). All these three CpG sites reside within or close to Fuz+117/+347CpG, and two of them were found negatively associated with Fuz expression in various cancer types, including ESCA, HNSC and LUAD (Figure 5B–5D). Such association was further validated by experimental evidence. When the esophageal carcinoma and lung adenocarcinoma cells were treated with 5-Azacytidine, Fuz transcription was upregulated (Figure 5E, 5F). In 2017, Hao et al. [24] demonstrated a negative correlation between Fuz expression and its promoter DNA methylation level in LIHC tumor samples at another CpG site, cg19763319, which is also close to the Fuz+117/+347CpG region. These findings highlight Fuz+117/+347CpG as a core regulatory element in governing Fuz transcription. Any possible dysregulation of the Fuz+117/+347CpG methylation level may contribute to the pathogenesis of human diseases, including cancer.
In this study, we also determined the functional consequence of mutant Fuz proteins, FuzR404* and FuzR404Q. The mutation at FuzR404 residue resides within a predicted Longin domain (a.a. 290-418) in the Fuz protein C-terminus [21, 31, 47]. When overexpressed in cells, the wildtype Fuz protein triggers cell apoptosis via activating Dvl-Rac1-MAPK-caspase signaling cascade [23]. However, such activation was found attenuated in FuzR404* or FuzR404Q-expressing cells, suggesting the deterioration of Fuz pro-apoptotic function (Figure 8). Since FuzR404* and FuzR404Q mutations were identified in cancer patient samples, this functional evidence may provide more clues on how the perturbation of Fuz protein functions leads to the cell overproliferation in certain types of cancer.
Both R404* and R404Q mutations occur in the highly conserved 404th arginine residue within the Fuz Longin domain [47]. The presence of Longin domain is broadly shared by vesicle trafficking proteins [48, 49]. These Longin domain-containing proteins transport specific cargos and target their membrane localization in support of cilia outgrowth, which is impaired when protein dysfunctions occur [11, 50]. Interestingly, the R404Q mutation was initially identified from human patients with neural tube defects, a severe neurological deficit due to the failure of neural tube closure during embryonic development, and Seo et al. [47] showed that FuzR404Q mutant prevents cilia elongation and directional cell movements. Taken together, these findings suggest the importance of Longin domain in carrying out Fuz biological function, especially in regulating ciliogenesis. In our functional experiments, we found that, both FuzR404* and FuzR404Q mutants alleviated the stimulation of cell apoptosis (Figure 8). It would therefore be intriguing to further investigate the functional significance of Longin domain with respect to the pro-apoptotic activity of Fuz protein.
In conclusion, our study is the first report to demonstrate the mechanistic insights of a PCP effector, Fuz, in multiple types of cancer. The development of interventions targeting Fuz DNA methylation alteration and coding sequence mutations may be therapeutically beneficial towards carcinogenesis.
Materials and Methods
Kaplan-Meier plotter analysis
The pan-cancer survey from the online database Kaplan-Meier Plotter (https://kmplot.com/analysis/index.php?p=service&cancer=pancancer_rnaseq) was used to evaluate the prognostic value of Fuz mRNA expression in 21 different types of cancer [51]. In particular, the prognostic value of Fuz mRNA expression in different breast cancer subtypes was analyzed separately (https://kmplot.com/analysis/index.php?p=service&cancer=breast). Moreover, the prognostic value of Fuz mRNA expression in additional Gene Expression Omnibus datasets of breast cancer (https://kmplot.com/analysis/index.php?p=service&cancer=breast), lung cancer (https://kmplot.com/analysis/index.php?p=service&cancer=lung) and gastric cancer (https://kmplot.com/analysis/index.php?p=service&cancer=gastric) was also assessed using Kaplan-Meier Plotter. The patient samples were split into two groups (high expression vs. low expression) based on the auto selected best cutoff for Fuz expression. The overall survival probability of cancer patients was assessed using the Kaplan-Meier survival plots, and logrank p value was calculated to determine whether the association between Fuz expression and patient survival is statistically significant.
Processing of TCGA data
The RNA sequencing data and DNA methylation data of primary tumor tissues and solid normal tissues were obtained from The Cancer Genome Atlas (TCGA) Research Network (https://www.cancer.gov/tcga) via the GDC Data Portal (https://portal.gdc.cancer.gov/) [52] on June 27, 2018. The raw gene expression counts generated by HTSeq [53] were imported to DESeq2 (1.24.0) [54] in R (v3.6.3) for normalization and the normalized gene counts were used for downstream analysis. DESeq2 was used to perform the differential gene expression analysis, and standard DESeq2 Wald test, followed by the Benjamini-Hochberg correction was used for multiple comparisons. Wilcoxon Rank Sum test followed by Benjamini-Hochberg correction was used to compare methylation levels between tumor and normal tissues. To determine the correlation between Fuz mRNA level and Fuz DNA methylation level, the normalized gene counts were regressed on the DNA methylation levels using linear model with the function ‘lm’ in R. The Cox regression was performed using the ‘survival’ (3.2.7) and ‘survminer’ (0.4.7) packages in R to determine the association between Fuz DNA methylation level and patient survival probabilities. Multivariate survival analysis was performed again, with ‘survival’ and survminer’, using the seven factors retrieved from the TCGA clinical data, including gender, race, ethnicity, primary_diagnosis, tumor stage and age at diagnosis. In addition, the normalized expression level of Fuz was also included.
Gene set enrichment analysis (GSEA)
The gene enrichment analysis was carried out using GSEA v4.0.3 software (https://www.gsea-msigdb.org/gsea/index.jsp) [55]. The gene ranks were generated by using DESeq2 to calculate fold changes of normalized gene counts between low Fuz and high Fuz expression groups in HNSC and LUAD tumor samples (Supplementary File 1). The annotated gene sets c5.go.v7.2.symbols.gmt was used for the Gene Ontology (GO) terms enrichment analysis, while the annotated gene set c2.cp.reactome.v7.2.symbols.gmt was used for the Reactome pathways enrichment analysis. The GSEAPreranked analysis was performed with the number of permutations set as 1,000 times for each analysis. The selection criteria for significantly enriched GO terms and Reactome pathways were |normalized enrichment score (NES)| > 2 and false discovery rate (FDR) q-value < 0.001.
Protein-protein interaction (PPI) network analysis
The PPI network analysis was performed using STRING v11.0 database (https://string-db.org/) [56]. The protein-protein interaction network was constructed based on experimental evidence, computational predictions and co-expression networks. Top 500 dysregulated genes selected based on |log2FC| from low Fuz expression groups were used as input, and the minimum required interaction score was defined as highest confidence (0.900) to carry out the prediction. The Cytoscape v3.8.0 was used to visualize the constructed PPI network, and Molecular Complex Detection (MCODE) algorithm was used to select densely connected networks. The significantly (FDR < 0.001) enriched GO terms in the MCODE networks were isolated from DAVID 6.8 database (https://david.ncifcrf.gov/home.jsp) [57].
cBioPortal analysis
cBioPortal v3.3.5 is a comprehensive web resource to provide visualization and analysis of cancer genomic data (https://www.cbioportal.org/) [58]. The genomic alteration profiles in Fuz, including mutations and copy number alterations, were obtained from 10,967 samples of 32 independent TCGA PanCancer Atlas Studies.
Molecular cloning
The pcDNA3.1 (zeo)-flag-Dvl was a kind gift from Prof. Randall Moon (Addgene plasmid # 16758). The Fuz-EGFP was described previously [23]. The FuzR404* DNA sequence was amplified from Fuz-EGFP using primers EcoRI-Fuz-F, 5`-CCGGAATTCATGGGGGAGGAGGGGAC-3` and KpnI-FuzR404 stop-R, 5`-CCGGGTACCGTTCACAGCCCATGGGTG-3`. The resultant DNA fragment was subcloned into pEGFP-N1 (Clontech Laboratories) expression vector using EcoRI and KpnI to generate FuzR404*-EGFP mutant construct. Overlapping PCR method was used to generate the FuzR404Q mutant sequence, the resultant DNA fragment was subcloned into pEGFP-N1 expression vector using EcoRI and KpnI to generate FuzR404Q-EGFP mutant construct. Primers used for overlapping PCR were EcoRI-Fuz-F, 5`-CCGGAATTCATGGGGGAGGAGGGGAC-3`, FuzR404Q-F, 5`- ACCCATGGGCTGCAAAGCCTGGCC-3`, FuzR404Q-R, 5`- GGCCAGGCTTTGCAGCCCATGGGT-3` and KpnI-Fuz-R, 5`- CCGGGTACCGTAAGAAGTGGGGTGAGG-3`.
Cell culture and plasmid transfection
The human esophageal carcinoma cell lines KYSE150 and KYSE510 were kind gifts from Prof. Qian Tao (Department of Clinical Oncology, The Chinese University of Hong Kong) [59]. The human endometrial adenocarcinoma cell line AN3 CA was a kind gift from Prof. Chi Chiu Wang (Department of Obstetrics and Gynecology, The Chinese University of Hong Kong). The human lung adenocarcinoma cell lines H4006 (CRL-2871™) and NCI-H1975 (CRL-5908™) were obtained from American Type Culture Collection. All cell lines were cultured using Gibco™ RPMI 1640 Medium (21875034, Thermo Fisher Scientific) supplemented with 10% fetal bovine serum (F7524, Sigma-Aldrich) and 1% Antibiotic-Antimycotic solution (15240062, Thermo Fisher Scientific). The cells were maintained in a 37° C humidified cell culture incubator supplemented with 5% CO2. Lipofectamine 2000 (11668019, Thermo Fisher Scientific) was used in plasmid transfection. The ratio between plasmid (μg) and Lipofectamine 2000 (μl) was 1:2. For immunocytochemistry samples preparation, 0.3 μg pcDNA3.1 (zeo)-flag-Dvl, together with 0.5 μg EGFP-N1, Fuz-EGFP, FuzR404*-EGFP or FuzR404Q-EGFP, were used for transfection. The transfection lasted for 48 h. For immunoblotting samples preparation, 1.0 μg EGFP-N1, Fuz-EGFP, FuzR404*-EGFP or FuzR404Q-EGFP was used for transfection, and the transfection lasted for 72 h. For cell proliferation assay, 0.3 μg EGFP-N1, Fuz-EGFP, FuzR404*-EGFP or FuzR404Q-EGFP was used for transfection, and the transfection lasted for 72 h.
Drug treatment
The KYSE150, KYSE510, H4006 and NCI-H1975 cells were treated with 2 μM 5-Azacytidine (0210082150, MP Biomedicals™). The treatment lasted 72 h, with medium and drug refreshed every 24 h.
Reverse transcription PCR
RNAs were extracted from cancer cell lines using the Qiagen RNeasy Mini Kit (74104, Qiagen). One microgram of RNA was used for reverse transcription using ImProm-IITM Reverse Transcription System (A3800, Promega), according to the manufacturer’s instructions. Primers used in this study were Human Fuz-119-F, 5`-TCTCTGTCATCGGTTCCCTC-3`; Human Fuz-366-R, 5`-CTCCACGTTGCGGATATTGG-3`; Actin-F, 5`-ATGTGCAAGGCCGGTTTCGC-3`; Actin-R, 5`-CGACACGCAGCTCATTGTAG-3`. The PCR products were amplified using Phusion™ High-Fidelity DNA Polymerase (F530S, Thermo Fisher Scientific) and visualized on the Bio-Rad ChemiDoc imaging system.
Immunocytochemistry
The AN3 CA cells were seeded on coverslips (Marienfeld-Superior). After 48 h, cells were transfected. After another 48 h, transfected cells were fixed with 3.7% paraformaldehyde for 15 min followed by permeabilization with 0.1% Triton X-100 for another 15 min. The cells were blocked with 5% goat serum at 25° C for 1 h, followed by the incubation with primary antibody at 4° C for 16 h. The cells were then washed 3 times with 1X PBS for 5 min each. The secondary antibody was used to incubate cells at 25° C for 1 h. The cells were then washed 5 times with 1X PBS for 5 min each. The primary and secondary antibodies used were anti-flag (1:200; F3165, Sigma-Aldrich) and goat anti-mouse IgG (H+L) Cy3 conjugate (1:400; 81-6515, Zymed, Thermo Fisher Scientific). The cell nuclei were stained with Hoechst 33342 (1:400; H-1399, Thermo Fisher Scientific) at 25° C for 5 min. Cell images were acquired using a confocal microscope Zeiss LSM (Zeiss) and images were analyzed using Fiji software (Version 2.0.0-rc-69/1.52n, NIH).
Immunoblotting
The AN3 CA cells were seeded in 24-well plates (3526, Corning). After 48 h, cells were transfected. After another 72 h, transfected cells were harvested in SDS sample buffer (100 mM Tris-HCl, pH 6.8, 2% SDS, 40% glycerol, 5% β-mercaptoethanol and 0.1% bromophenol blue). Samples were heated at 99° C for 10 min prior to being subjected to the immunoblot analysis. Primary antibodies used were anti-p-JNK (1:500, 9251, Cell Signaling Technology), anti-JNK (1:1,000, 9252, Cell Signaling Technology), anti-cleaved caspase-3 (1:500; 9664, Cell Signaling Technology), anti-GFP (1:2,000; 632381, Clontech Laboratories, Inc.) and anti-β-tubulin (1:2,000; ab6046, Abcam). Secondary antibodies used for immunoblotting were HRP conjugated Goat anti-Rabbit IgG (H+L) (1:5,000, G-21234, Thermo Fisher scientific) and HRP conjugated Goat anti-Mouse IgG (H+L) (1:5,000, G-21040, Thermo Fisher Scientific). The signal was developed using Immobilon Forte Western HRP substrate (WBLUF0100, Merck Millipore) and visualized on the Bio-Rad ChemiDoc imaging system.
Cell proliferation assay
The AN3 CA cells were seeded in 96-well plates (3603, Corning). After 48 h, cells were transfected. After another 72 h, transfected cells were added with CellTiter 96® AQueous One Solution Reagent (G3582, Promega). The reaction was incubated at 37° C for 1 h, followed by the measurement of absorbance at 490 nm on a FLUOstar Omega Microplate Reader (BMG LABTECH).
Supplementary Materials
Author Contributions
Z.S.C. and H.Y.E.C. designed research; Z.S.C. and X.L. performed experiments and analyzed data; Z.S.C., X.L., T.F.C. and H.Y.E.C. interpreted the results and wrote the paper.
Conflicts of Interest
The authors declare that they have no conflicts of interest.
Funding
This work was supported by the General Research Fund (14100714) of the Hong Kong Research Grants Council, CUHK Vice-Chancellor Discretionary Fund (VCF2014011 and EC/2017/012) and CUHK Gerald Choa Neuroscience Centre (7105306) (to H.Y.E.C.), and a Postdoctoral Fellowship in Clinical Neurosciences program between The Chinese University of Hong Kong and University of Oxford (Nuffield Department of Clinical Neurosciences and Pembroke College) supported by the Lee Hysan Foundation (to Z.S.C.).
References
- 1. Sellers KJ, Elliott C, Jackson J, Ghosh A, Ribe E, Rojo AI, Jarosz-Griffiths HH, Watson IA, Xia W, Semenov M, Morin P, Hooper NM, Porter R, et al. Amyloid β synaptotoxicity is Wnt-PCP dependent and blocked by fasudil. Alzheimers Dement. 2018; 14:306–17. https://doi.org/10.1016/j.jalz.2017.09.008 [PubMed]
- 2. Torban E, Wang HJ, Groulx N, Gros P. Independent mutations in mouse Vangl2 that cause neural tube defects in looptail mice impair interaction with members of the dishevelled family. J Biol Chem. 2004; 279:52703–13. https://doi.org/10.1074/jbc.M408675200 [PubMed]
- 3. Yu H, Smallwood PM, Wang Y, Vidaltamayo R, Reed R, Nathans J. Frizzled 1 and frizzled 2 genes function in palate, ventricular septum and neural tube closure: general implications for tissue fusion processes. Development. 2010; 137:3707–17. https://doi.org/10.1242/dev.052001 [PubMed]
- 4. Heydeck W, Liu A. PCP effector proteins inturned and fuzzy play nonredundant roles in the patterning but not convergent extension of mammalian neural tube. Dev Dyn. 2011; 240:1938–48. https://doi.org/10.1002/dvdy.22696 [PubMed]
- 5. Katoh M. Wnt/PCP signaling pathway and human cancer (review). Oncol Rep. 2005; 14:1583–88. https://doi.org/10.3892/or.14.6.1583 [PubMed]
- 6. Corda G, Sala A. Non-canonical Wnt/PCP signalling in cancer: Fzd6 takes centre stage. Oncogenesis. 2017; 6:e364. https://doi.org/10.1038/oncsis.2017.69 [PubMed]
- 7. Butler MT, Wallingford JB. Planar cell polarity in development and disease. Nat Rev Mol Cell Biol. 2017; 18:375–88. https://doi.org/10.1038/nrm.2017.11 [PubMed]
- 8. Wong LL, Adler PN. Tissue polarity genes of drosophila regulate the subcellular location for prehair initiation in pupal wing cells. J Cell Biol. 1993; 123:209–21. https://doi.org/10.1083/jcb.123.1.209 [PubMed]
- 9. Wang Y, Yan J, Lee H, Lu Q, Adler PN. The proteins encoded by the drosophila planar polarity effector genes inturned, fuzzy and fritz interact physically and can re-pattern the accumulation of ”upstream“ planar cell polarity proteins. Dev Biol. 2014; 394:156–69. https://doi.org/10.1016/j.ydbio.2014.07.013 [PubMed]
- 10. Park TJ, Haigo SL, Wallingford JB. Ciliogenesis defects in embryos lacking inturned or fuzzy function are associated with failure of planar cell polarity and hedgehog signaling. Nat Genet. 2006; 38:303–11. https://doi.org/10.1038/ng1753 [PubMed]
- 11. Zilber Y, Babayeva S, Seo JH, Liu JJ, Mootin S, Torban E. The PCP effector fuzzy controls cilial assembly and signaling by recruiting Rab8 and dishevelled to the primary cilium. Mol Biol Cell. 2013; 24:555–65. https://doi.org/10.1091/mbc.E12-06-0437 [PubMed]
- 12. Riggi N, Aguet M, Stamenkovic I. Cancer metastasis: a reappraisal of its underlying mechanisms and their relevance to treatment. Annu Rev Pathol. 2018; 13:117–40. https://doi.org/10.1146/annurev-pathol-020117-044127 [PubMed]
- 13. Feitelson MA, Arzumanyan A, Kulathinal RJ, Blain SW, Holcombe RF, Mahajna J, Marino M, Martinez-Chantar ML, Nawroth R, Sanchez-Garcia I, Sharma D, Saxena NK, Singh N, et al. Sustained proliferation in cancer: mechanisms and novel therapeutic targets. Semin Cancer Biol. 2015; 35:S25–54. https://doi.org/10.1016/j.semcancer.2015.02.006 [PubMed]
- 14. Zhan T, Rindtorff N, Boutros M. Wnt signaling in cancer. Oncogene. 2017; 36:1461–73. https://doi.org/10.1038/onc.2016.304 [PubMed]
- 15. Aster JC, Pear WS, Blacklow SC. The varied roles of notch in cancer. Annu Rev Pathol. 2017; 12:245–75. https://doi.org/10.1146/annurev-pathol-052016-100127 [PubMed]
- 16. Calses PC, Crawford JJ, Lill JR, Dey A. Hippo pathway in cancer: aberrant regulation and therapeutic opportunities. Trends Cancer. 2019; 5:297–307. https://doi.org/10.1016/j.trecan.2019.04.001 [PubMed]
- 17. VanderVorst K, Hatakeyama J, Berg A, Lee H, Carraway KL 3rd. Cellular and molecular mechanisms underlying planar cell polarity pathway contributions to cancer Malignancy. Semin Cell Dev Biol. 2018; 81:78–87. https://doi.org/10.1016/j.semcdb.2017.09.026 [PubMed]
- 18. Daulat AM, Bertucci F, Audebert S, Sergé A, Finetti P, Josselin E, Castellano R, Birnbaum D, Angers S, Borg JP. PRICKLE1 contributes to cancer cell dissemination through its interaction with mTORC2. Dev Cell. 2016; 37:311–25. https://doi.org/10.1016/j.devcel.2016.04.011 [PubMed]
- 19. Zhang L, Luga V, Armitage SK, Musiol M, Won A, Yip CM, Plotnikov SV, Wrana JL. A lateral signalling pathway coordinates shape volatility during cell migration. Nat Commun. 2016; 7:11714. https://doi.org/10.1038/ncomms11714 [PubMed]
- 20. Dyberg C, Papachristou P, Haug BH, Lagercrantz H, Kogner P, Ringstedt T, Wickström M, Johnsen JI. Planar cell polarity gene expression correlates with tumor cell viability and prognostic outcome in neuroblastoma. BMC Cancer. 2016; 16:259. https://doi.org/10.1186/s12885-016-2293-2 [PubMed]
- 21. Gray RS, Abitua PB, Wlodarczyk BJ, Szabo-Rogers HL, Blanchard O, Lee I, Weiss GS, Liu KJ, Marcotte EM, Wallingford JB, Finnell RH. The planar cell polarity effector Fuz is essential for targeted membrane trafficking, ciliogenesis and mouse embryonic development. Nat Cell Biol. 2009; 11:1225–32. https://doi.org/10.1038/ncb1966 [PubMed]
- 22. Zhang Z, Wlodarczyk BJ, Niederreither K, Venugopalan S, Florez S, Finnell RH, Amendt BA. Fuz regulates craniofacial development through tissue specific responses to signaling factors. PLoS One. 2011; 6:e24608. https://doi.org/10.1371/journal.pone.0024608 [PubMed]
- 23. Chen ZS, Li L, Peng S, Chen FM, Zhang Q, An Y, Lin X, Li W, Koon AC, Chan TF, Lau KF, Ngo JC, Wong WT, et al. Planar cell polarity gene Fuz triggers apoptosis in neurodegenerative disease models. EMBO Rep. 2018; 19:e45409. https://doi.org/10.15252/embr.201745409 [PubMed]
- 24. Hao X, Luo H, Krawczyk M, Wei W, Wang W, Wang J, Flagg K, Hou J, Zhang H, Yi S, Jafari M, Lin D, Chung C, et al. DNA methylation markers for diagnosis and prognosis of common cancers. Proc Natl Acad Sci USA. 2017; 114:7414–19. https://doi.org/10.1073/pnas.1703577114 [PubMed]
- 25. Greenberg MV, Bourc’his D. The diverse roles of DNA methylation in mammalian development and disease. Nat Rev Mol Cell Biol. 2019; 20:590–607. https://doi.org/10.1038/s41580-019-0159-6 [PubMed]
- 26. Chakravarthi BV, Nepal S, Varambally S. Genomic and epigenomic alterations in cancer. Am J Pathol. 2016; 186:1724–35. https://doi.org/10.1016/j.ajpath.2016.02.023 [PubMed]
- 27. Li LC, Dahiya R. MethPrimer: designing primers for methylation PCRs. Bioinformatics. 2002; 18:1427–31. https://doi.org/10.1093/bioinformatics/18.11.1427 [PubMed]
- 28. Yang N, Leung EL, Liu C, Li L, Eguether T, Jun Yao XJ, Jones EC, Norris DA, Liu A, Clark RA, Roop DR, Pazour GJ, Shroyer KR, Chen J. INTU is essential for oncogenic Hh signaling through regulating primary cilia formation in basal cell carcinoma. Oncogene. 2017; 36:4997–5005. https://doi.org/10.1038/onc.2017.117 [PubMed]
- 29. He Z, Wu X, Ma S, Zhang C, Zhang Z, Wang S, Yu S, Wang Q. Next-generation sequencing identified a novel WDPCP-ALK fusion sensitive to crizotinib in lung adenocarcinoma. Clin Lung Cancer. 2019; 20:e548–51. https://doi.org/10.1016/j.cllc.2019.06.001 [PubMed]
- 30. Natanzon Y, Earp M, Cunningham JM, Kalli KR, Wang C, Armasu SM, Larson MC, Bowtell DD, Garsed DW, Fridley BL, Winham SJ, Goode EL. Genomic analysis using regularized regression in high-grade serous ovarian cancer. Cancer Inform. 2018; 17:1176935118755341. https://doi.org/10.1177/1176935118755341 [PubMed]
- 31. Gerondopoulos A, Strutt H, Stevenson NL, Sobajima T, Levine TP, Stephens DJ, Strutt D, Barr FA. Planar cell polarity effector proteins inturned and fuzzy form a Rab23 GEF complex. Curr Biol. 2019; 29:3323–30.e8. https://doi.org/10.1016/j.cub.2019.07.090 [PubMed]
- 32. Tan WL, Jain A, Takano A, Newell EW, Iyer NG, Lim WT, Tan EH, Zhai W, Hillmer AM, Tam WL, Tan DS. Novel therapeutic targets on the horizon for lung cancer. Lancet Oncol. 2016; 17:e347–62. https://doi.org/10.1016/S1470-2045(16)30123-1 [PubMed]
- 33. Johnson DE, Burtness B, Leemans CR, Lui VW, Bauman JE, Grandis JR. Head and neck squamous cell carcinoma. Nat Rev Dis Primers. 2020; 6:92. https://doi.org/10.1038/s41572-020-00224-3 [PubMed]
- 34. Sanchez-Vega F, Mina M, Armenia J, Chatila WK, Luna A, La KC, Dimitriadoy S, Liu DL, Kantheti HS, Saghafinia S, Chakravarty D, Daian F, Gao Q, et al, and Cancer Genome Atlas Research Network. Oncogenic signaling pathways in the cancer genome atlas. Cell. 2018; 173:321–37.e10. https://doi.org/10.1016/j.cell.2018.03.035 [PubMed]
- 35. Dominguez-Brauer C, Thu KL, Mason JM, Blaser H, Bray MR, Mak TW. Targeting mitosis in cancer: emerging strategies. Mol Cell. 2015; 60:524–36. https://doi.org/10.1016/j.molcel.2015.11.006 [PubMed]
- 36. Kastan MB, Bartek J. Cell-cycle checkpoints and cancer. Nature. 2004; 432:316–23. https://doi.org/10.1038/nature03097 [PubMed]
- 37. Beckerman R, Prives C. Transcriptional regulation by p53. Cold Spring Harb Perspect Biol. 2010; 2:a000935. https://doi.org/10.1101/cshperspect.a000935 [PubMed]
- 38. Diab A, Gem H, Swanger J, Kim HY, Smith K, Zou G, Raju S, Kao M, Fitzgibbon M, Loeb KR, Rodriguez CP, Méndez E, Galloway DA, et al. FOXM1 drives HPV+ HNSCC sensitivity to WEE1 inhibition. Proc Natl Acad Sci USA. 2020; 117:28287–96. https://doi.org/10.1073/pnas.2013921117 [PubMed]
- 39. van Harten AM, Buijze M, van der Mast R, Rooimans MA, Martens-de Kemp
SR , Bachas C, Brink A, Stigter-van Walsum M, Wolthuis RM, Brakenhoff RH. Targeting the cell cycle in head and neck cancer by Chk1 inhibition: a novel concept of bimodal cell death. Oncogenesis. 2019; 8:38. https://doi.org/10.1038/s41389-019-0147-x [PubMed] - 40. Zhou G, Liu Z, Myers JN. TP53 mutations in head and neck squamous cell carcinoma and their impact on disease progression and treatment response. J Cell Biochem. 2016; 117:2682–92. https://doi.org/10.1002/jcb.25592 [PubMed]
- 41. Verduci L, Ferraiuolo M, Sacconi A, Ganci F, Vitale J, Colombo T, Paci P, Strano S, Macino G, Rajewsky N, Blandino G. The oncogenic role of circPVT1 in head and neck squamous cell carcinoma is mediated through the mutant p53/YAP/TEAD transcription-competent complex. Genome Biol. 2017; 18:237. https://doi.org/10.1186/s13059-017-1368-y [PubMed]
- 42. Ganci F, Pulito C, Valsoni S, Sacconi A, Turco C, Vahabi M, Manciocco V, Mazza EM, Meens J, Karamboulas C, Nichols AC, Covello R, Pellini R, et al. PI3K inhibitors curtail MYC-dependent mutant p53 gain-of-function in head and neck squamous cell carcinoma. Clin Cancer Res. 2020; 26:2956–71. https://doi.org/10.1158/1078-0432.CCR-19-2485 [PubMed]
- 43. Caponio VC, Troiano G, Adipietro I, Zhurakivska K, Arena C, Mangieri D, Mascitti M, Cirillo N, Lo Muzio L. Computational analysis of TP53 mutational landscape unveils key prognostic signatures and distinct pathobiological pathways in head and neck squamous cell cancer. Br J Cancer. 2020; 123:1302–14. https://doi.org/10.1038/s41416-020-0984-6 [PubMed]
- 44. Fukui T, Shaykhiev R, Agosto-Perez F, Mezey JG, Downey RJ, Travis WD, Crystal RG. Lung adenocarcinoma subtypes based on expression of human airway basal cell genes. Eur Respir J. 2013; 42:1332–44. https://doi.org/10.1183/09031936.00144012 [PubMed]
- 45. Auerbach O, Stout AP. Histopathological aspects of occult cancer of the lung. Ann N Y Acad Sci. 1964; 114:803–10. https://doi.org/10.1111/j.1749-6632.1964.tb40999.x [PubMed]
- 46. Bao Z, Huang WJ. Thioridazine promotes primary ciliogenesis in lung cancer cells through enhancing cell autophagy. Int J Clin Exp Med. 2017; 10:13960–69.
- 47. Seo JH, Zilber Y, Babayeva S, Liu J, Kyriakopoulos P, De Marco P, Merello E, Capra V, Gros P, Torban E. Mutations in the planar cell polarity gene, fuzzy, are associated with neural tube defects in humans. Hum Mol Genet. 2011; 20:4324–33. https://doi.org/10.1093/hmg/ddr359 [PubMed]
- 48. Daste F, Galli T, Tareste D. Structure and function of longin SNAREs. J Cell Sci. 2015; 128:4263–72. https://doi.org/10.1242/jcs.178574 [PubMed]
- 49. De Franceschi N, Wild K, Schlacht A, Dacks JB, Sinning I, Filippini F. Longin and GAF domains: structural evolution and adaptation to the subcellular trafficking machinery. Traffic. 2014; 15:104–21. https://doi.org/10.1111/tra.12124 [PubMed]
- 50. Kandachar V, Tam BM, Moritz OL, Deretic D. An interaction network between the SNARE VAMP7 and rab GTPases within a ciliary membrane-targeting complex. J Cell Sci. 2018; 131:jcs222034. https://doi.org/10.1242/jcs.222034 [PubMed]
- 51. Nagy Á, Lánczky A, Menyhárt O, Győrffy B. Validation of miRNA prognostic power in hepatocellular carcinoma using expression data of independent datasets. Sci Rep. 2018; 8:9227. https://doi.org/10.1038/s41598-018-27521-y [PubMed]
- 52. Grossman RL, Heath AP, Ferretti V, Varmus HE, Lowy DR, Kibbe WA, Staudt LM. Toward a shared vision for cancer genomic data. N Engl J Med. 2016; 375:1109–12. https://doi.org/10.1056/NEJMp1607591 [PubMed]
- 53. Anders S, Pyl PT, Huber W. HTSeq—a python framework to work with high-throughput sequencing data. Bioinformatics. 2015; 31:166–69. https://doi.org/10.1093/bioinformatics/btu638 [PubMed]
- 54. Love MI, Huber W, Anders S. Moderated estimation of fold change and dispersion for RNA-seq data with DESeq2. Genome Biol. 2014; 15:550. https://doi.org/10.1186/s13059-014-0550-8 [PubMed]
- 55. Subramanian A, Tamayo P, Mootha VK, Mukherjee S, Ebert BL, Gillette MA, Paulovich A, Pomeroy SL, Golub TR, Lander ES, Mesirov JP. Gene set enrichment analysis: a knowledge-based approach for interpreting genome-wide expression profiles. Proc Natl Acad Sci USA. 2005; 102:15545–50. https://doi.org/10.1073/pnas.0506580102 [PubMed]
- 56. Szklarczyk D, Gable AL, Lyon D, Junge A, Wyder S, Huerta-Cepas J, Simonovic M, Doncheva NT, Morris JH, Bork P, Jensen LJ, Mering CV. STRING v11: protein-protein association networks with increased coverage, supporting functional discovery in genome-wide experimental datasets. Nucleic Acids Res. 2019; 47:D607–13. https://doi.org/10.1093/nar/gky1131 [PubMed]
- 57. Huang da W, Sherman BT, Lempicki RA. Systematic and integrative analysis of large gene lists using DAVID bioinformatics resources. Nat Protoc. 2009; 4:44–57. https://doi.org/10.1038/nprot.2008.211 [PubMed]
- 58. Gao J, Aksoy BA, Dogrusoz U, Dresdner G, Gross B, Sumer SO, Sun Y, Jacobsen A, Sinha R, Larsson E, Cerami E, Sander C, Schultz N. Integrative analysis of complex cancer genomics and clinical profiles using the cBioPortal. Sci Signal. 2013; 6:pl1. https://doi.org/10.1126/scisignal.2004088 [PubMed]
- 59. Li L, Xu J, Qiu G, Ying J, Du Z, Xiang T, Wong KY, Srivastava G, Zhu XF, Mok TS, Chan AT, Chan FK, Ambinder RF, Tao Q. Epigenomic characterization of a p53-regulated 3p22.2 tumor suppressor that inhibits STAT3 phosphorylation via protein docking and is frequently methylated in esophageal and other carcinomas. Theranostics. 2018; 8:61–77. https://doi.org/10.7150/thno.20893 [PubMed]