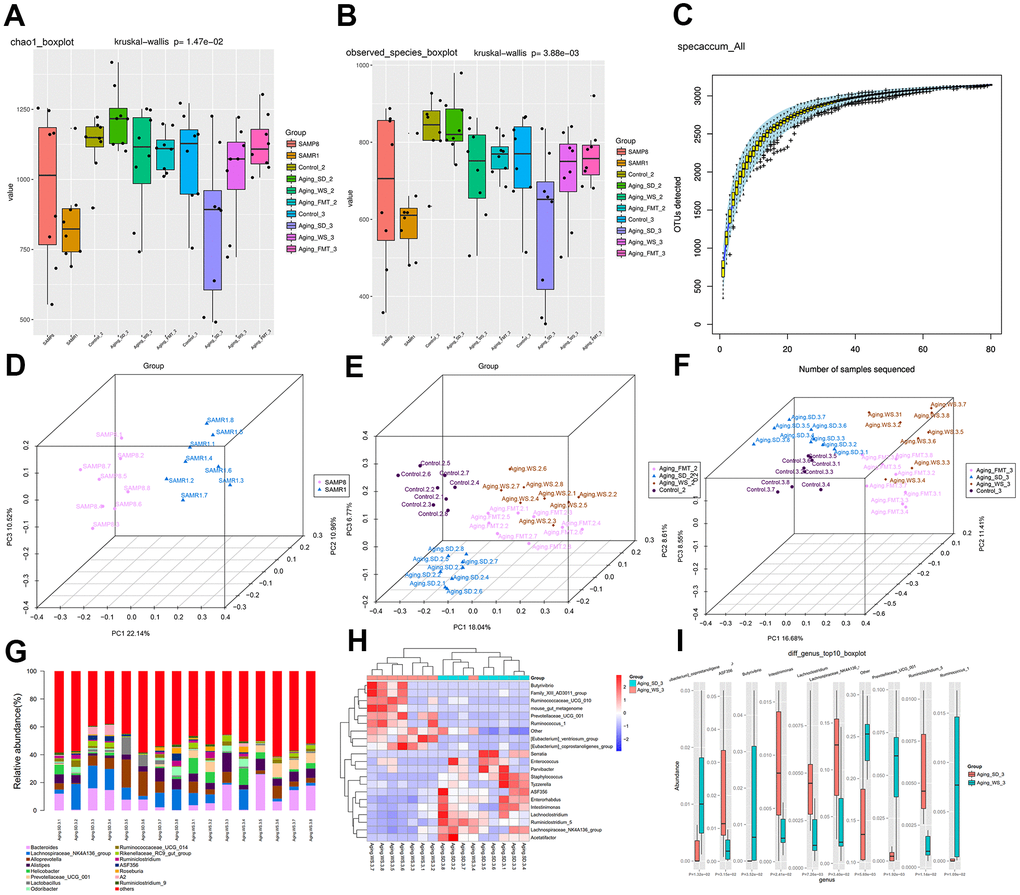
Figure 3.The α- and β-diversity of gut microbiota from feces samples. (A) Chao1 index of gut microbes in mice from the four groups. (B) The species index of gut microbes in mice from four groups. (C) Species accumulation curves. The X-axis represents the number of microbial samples sequenced, whereas the Y-axis represents the number of OTU detected. (D) PCoA plot showing the distribution of feces samples from SAMP8 and SAMR1 mice at the experiment baseline. (E) PCoA plot showing the distributions of plasma samples detected in four groups at the experiment’s metaphase. (F) PCoA plot showing the distributions of plasma samples from SAMP8 and SAMR1 mice at the experimental endpoint. The different colors represent samples from different groups. The closer the samples are, the more similar the microbial composition and structure between the samples. (G) The relative abundance of the top 15 differential OTUs between the WS and SD groups. (H) The heatmap for the top 20 differential OTUs. (I) The boxplot for the top 10 differential OTUs.