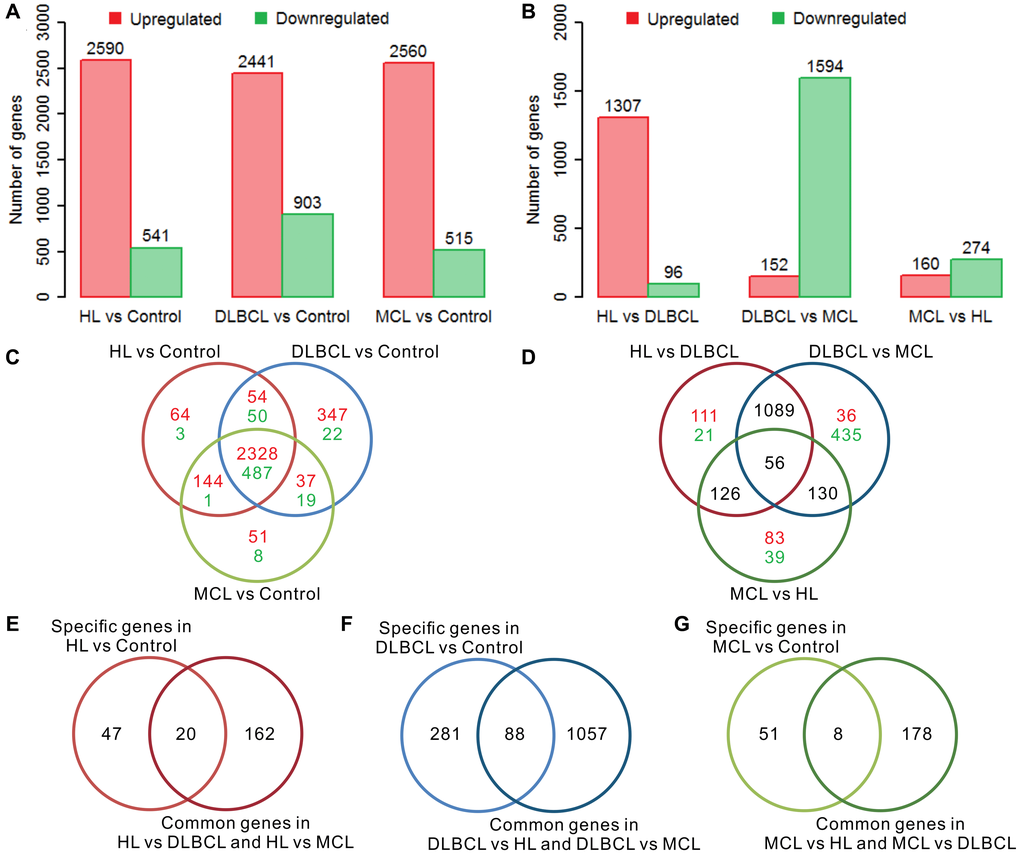
Figure 1.Differential gene expression analysis of three lymphomas. (A) The number of differentially expressed genes (DEGs) in lymphoma samples compared to controls. (B) The number of intergroup difference genes (IDGs) in three types of lymphoma. (C) Venn diagram of DEGs in lymphomas compared to controls. The red color indicates the number of upregulated genes and the green color indicates the number of downregulated genes. The expression trends of these genes are consistent in different types of lymphoma compared with controls. (D) Venn diagram of the IDGs between the lymphoma groups. The red color indicates the number of upregulated genes and the green color indicates the number of downregulated genes. (E) Venn diagram of HL-specific DEGs and HL common IDGs. (F) Venn diagram of DLBCL-specific DEGs and DLBCL common IDGs. (G) Venn diagram of MCL-specific DEGs and MCL common IDGs. The red bar indicates the upregulated genes, and the green bar indicates the downregulated genes. HL, Hodgkin's lymphoma; DLBCL, diffuse large B-cell lymphoma; MCL, mantle cell lymphoma.