


Introduction
Lymphoma is a malignant tumor originating from the lymphoid hematopoietic system and is mainly divided into two categories: Hodgkin's lymphoma (HL) and non-Hodgkin's lymphoma (NHL). Lymphoma is considered to be a chemosensitive tumor and the risk of lymphoma increases significantly with age [1]. Weakened organismal functions, defects in cellular and tissue homeostasis, immune deficiency, and multiple genetic alterations such as increased DNA damage in cells were correlated with aging. These risk factors are also the main causes of many cancers such as lymphoma [2]. Studies have reported that many anti-aging measures are also helpful in the treatment of lymphoma [2]. Enhancing the expression of anti-aging genes can be an effective way to inhibit lymphoma, a recent study showed that enforced expression of Klotho could significantly induce cell apoptosis and inhibit tumor growth in diffuse large B-cell lymphoma (DLBCL) [3]. Furthermore, downregulated telomere-binding genes (TRF1, TRF2, and POT1) lead to complex chromosomal aberrations, alternative lengthening of telomeres, and induced the progression of HL [4].
According to the WHO classification of lymphoid neoplasias (2016 version), more than 40 types of lymphoma are recognized, with clinical behaviors spanning from remarkably indolent to profoundly aggressive [5]. There are many subtypes of NHL and the most common of which is DLBCL. HL and DLBCL are B-cell-derived lymphomas with high incidence [6]. Mantle cell lymphoma (MCL) is a rare type of B-cell lymphoma that is still incurable, accounting for about 3-6% of all NHL because of its high malignant aggressiveness [7]. There are large differences in histological classification, pathological diagnostic markers, clinical treatment, and prognostic status among HL, DLBCL, and MCL [7–9]. The prognosis of the three B cell-derived lymphoma subtypes is quite different [7, 9, 10]. Especially the prognosis of MCL patients is very poor, and many therapy methods have not achieved the expected outcomes [11].
The different types of lymphoma or lymphoma subtypes can be distinguished by gene expression profiling [12]. Several genes can be used as diagnostic markers for specific types of lymphoma. The ligands of the tumor necrosis factor (TNF) family (APRIL and BAFF) showed high specificity and sensitivity in the diagnosis of central nervous system lymphoma [13]. The high expression of FOXP-1 in pediatric-type follicular lymphoma can also distinguish it from follicular hyperplasia [14]. Furthermore, high-throughput T cell receptor (TCR) gene sequencing technology facilitates the detection of early-stage cutaneous T-cell lymphoma [15]. However, most of the previous lymphoma diagnostic or prognostic models did not consider the heterogeneity among different tumors or subtypes [16–20]. Due to a large number of lymphoma subtypes, some genes may show consistent differential expression in multiple lymphoma subtypes that may interfere with the diagnostic specificity. Furthermore, complex gene-gene interactions also affect the accuracy of tumor diagnosis [21] and prognostic status [22]. Therefore, a diagnostic model with excellent performance should also be robust and hardly affected by gene-gene interactions.
The identification of tumor subtypes contributes to the effective treatment of the disease and prolongs the survival of cancer patients. Using gene expression characteristics to screen specific molecular markers is an effective approach to distinguish tumor subtypes. Through the identification of subtype-specific genes and constructing corresponding models, researchers can accurately perform subtype-specific diagnosis and prognostic evaluation for various tumor patients [23–25]. Currently, the diagnosis of HL, DLBCL, and MCL is mainly based on the morphology and the different combinations of CD surface antigens [26]. The clinical application of genotyping differences among these lymphomas is still limited, and there is lacking an effective molecular diagnostic model. Therefore, this study aims to screen for subtype-specific marker genes and constructed lymphoma-specific diagnostic models, and then explore the related biological functions and prognostic status of these specific molecular markers.
Results
Differentially expressed genes overview
There were more than 3000 differentially expressed genes (DEGs) in the tumor samples compared to the controls in each type of lymphoma, and most of the genes were upregulated (Figure 1A). Most of these differentially expressed genes are upregulated, and a few genes are downregulated. This result is consistent with previous reports that the number of up-regulated genes in different lymphomas is much greater than down-regulated genes [27–29]. Regarding the intergroup comparisons, DLBCL showed a large difference compared with the other two lymphomas, whereas only a small difference was detected between HL and MCL (Figure 1B). There were 67, 369, and 59 specific DEGs in HL vs. control, DLBCL vs. control, and MCL vs. control, respectively (Figure 1C). Furthermore, the results of the intergroup comparisons suggest that there were 182 intergroup difference genes (IDGs) shared by HL vs. DLBCL and HL vs. MCL, 1145 IDGs shared by DLBCL vs. HL and DLBCL vs. MCL, and 186 IDGs shared by MCL vs. HL and MCL vs. DLBCL (Figure 1D). According to the screening criteria for lymphoma-specific genes (defined as the intersection of specific differentially expressed genes in lymphoma samples compared to controls and the common intergroup differentially expressed genes in different lymphoma groups), we identified 20 HL-specific genes (Figure 1E), 88 DLBCL-specific genes (Figure 1F) and 8 MCL-specific genes (Figure 1G). The GO enrichment results showed that the HL specific genes are mainly involved in muscle functions, differentiation, and development functions; the DLBCL specific genes are mainly involved in proliferation, development, and neuromodulation functions; and the MCL specific genes are mainly involved in multiple immune-related functions (Supplementary Table 1). Interestingly, most of the HL-specific genes were upregulated, whereas more than 90% of the DLBCL-specific genes were downregulated. Half of the MCL-specific genes were upregulated while the other half were downregulated.
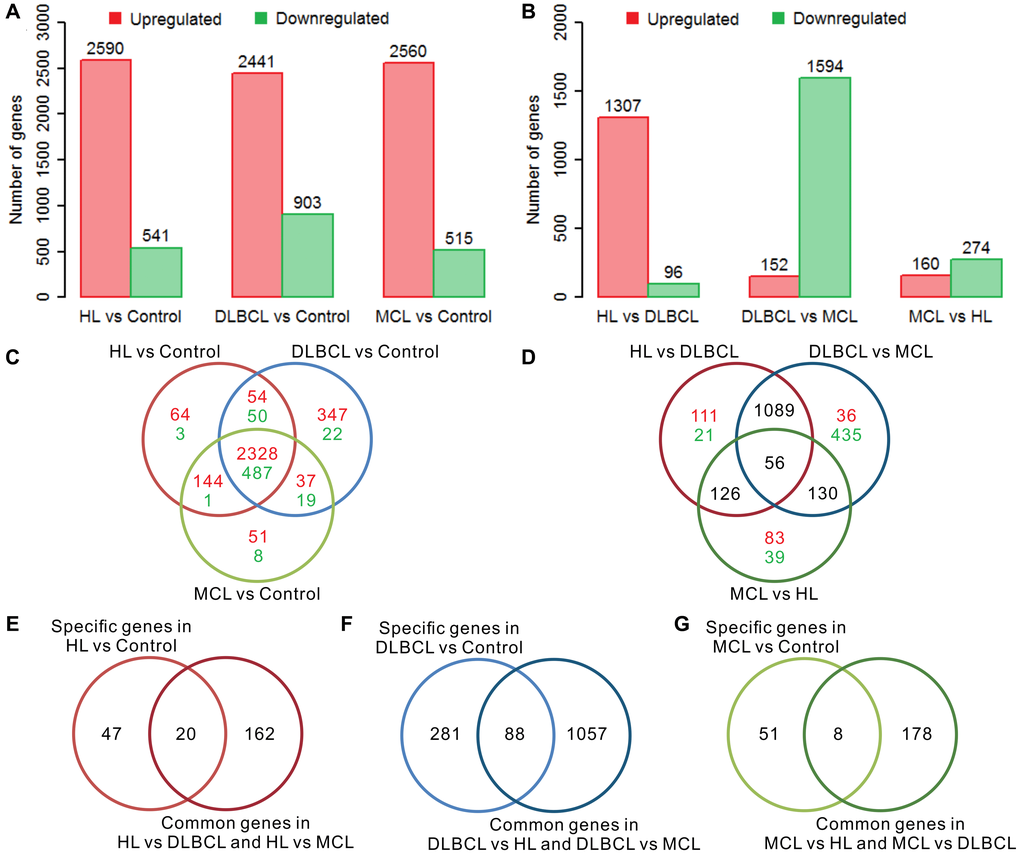
Figure 1. Differential gene expression analysis of three lymphomas. (A) The number of differentially expressed genes (DEGs) in lymphoma samples compared to controls. (B) The number of intergroup difference genes (IDGs) in three types of lymphoma. (C) Venn diagram of DEGs in lymphomas compared to controls. The red color indicates the number of upregulated genes and the green color indicates the number of downregulated genes. The expression trends of these genes are consistent in different types of lymphoma compared with controls. (D) Venn diagram of the IDGs between the lymphoma groups. The red color indicates the number of upregulated genes and the green color indicates the number of downregulated genes. (E) Venn diagram of HL-specific DEGs and HL common IDGs. (F) Venn diagram of DLBCL-specific DEGs and DLBCL common IDGs. (G) Venn diagram of MCL-specific DEGs and MCL common IDGs. The red bar indicates the upregulated genes, and the green bar indicates the downregulated genes. HL, Hodgkin's lymphoma; DLBCL, diffuse large B-cell lymphoma; MCL, mantle cell lymphoma.
Expression and function of the lymphoma marker genes
There were 20 lymphoma-specific genes (9 HL marker genes, 7 DLBCL marker genes, and 4 MCL marker genes) with a mean absolute value of intergroup fold-change high than 0.5 that were defined as lymphoma marker genes (Figure 2A). Among these genes, IL9, SFTPA2, and IGLV3-19 showed the highest specificity in HL, DLBCL, and MCL, respectively. The GO enrichment results showed that these marker genes were mainly involved in the regulation of various immune response and metabolic processes (Supplementary Table 2). Gene-gene interaction analysis proved that most marker genes were independently correlated with lymphoma status (Supplementary Table 3). The high expression of MYH2 increased HL risk whereas the high expression of LIPF and IGLV3-19 reduced DLBCL and MCL risk. The functional interaction network shows that most of the HL marker genes showed coexpression relationships with each other (Figure 2B). DLBCL and MCL marker genes showed multiple interaction relationships with other genes (Figure 2C and 2D). The enrichment results suggest that HL marker genes are mainly involved in actin- and cytoskeleton-related functions (Figure 2E), DLBCL marker genes are mainly involved in chromatin modification and regulation processes (Figure 2F), and MCL marker genes correlate with organismal homeostasis (Figure 2G). The prognostic analysis shows that IL9 and CRNN correlated with the International Prognostic Score (IPS) in HL (Supplementary Figure 1). Furthermore, low expression of CCDC144B and PHF1 and high expression of HP, LIPF, and SFTPA2 correlate with poor overall survival and progression-free survival in DLBCL (Supplementary Figure 2).
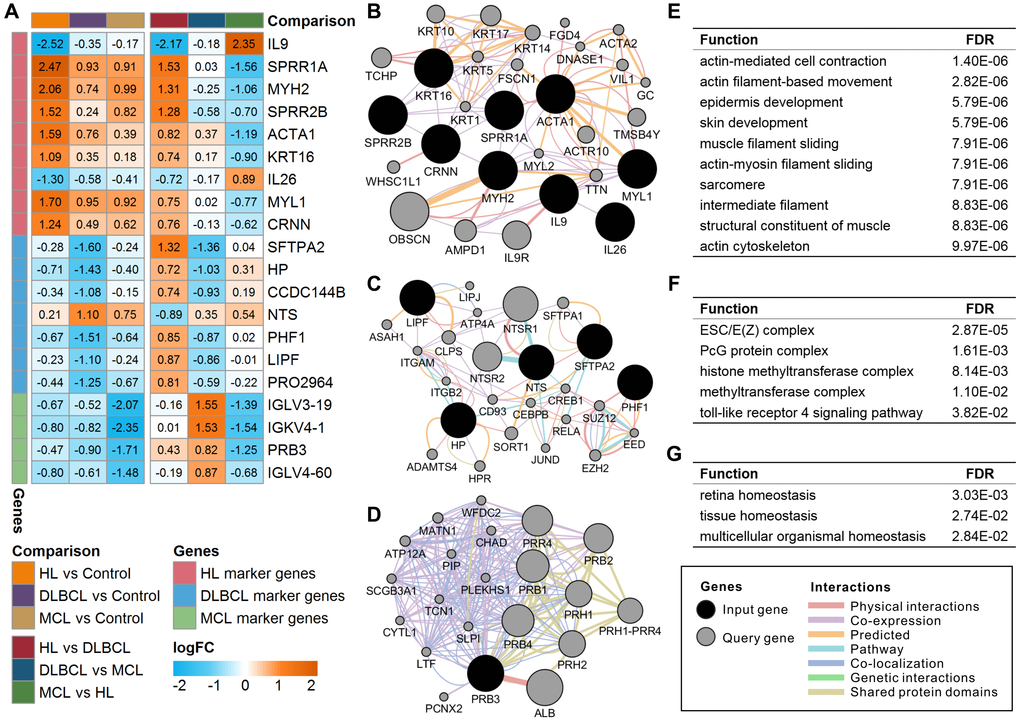
Figure 2. Expression and functional interaction network of lymphoma marker genes. (A) Log2 transformed the fold-change (logFC) of lymphoma marker genes in different comparisons. The orange color indicates the logFC of the gene > 0, and the cyan color indicates the logFC of the gene < 0. (B) Functional interaction network of HL marker genes. (C) Functional interaction network of DLBCL marker genes. No records of CCDC144B or PRO2964 were found in the GeneMANIA database. (D) Functional interaction network of MCL marker genes. No records of IGLV3-19, IGKV4-1, or IGLV4-60 were found in the GeneMANIA database. (E) Enriched functions of HL marker genes and query genes. (F) Enriched functions of DLBCL marker genes and query genes. (G) Enriched functions of MCL marker genes and query genes. HL, Hodgkin's lymphoma; DLBCL, diffuse large B-cell lymphoma; MCL, mantle cell lymphoma.
Single-gene prediction model
A logistic regression model showed that all these marker genes could significantly separate the lymphoma samples from the controls (Figure 3A–3C). The odds ratios of these marker genes are relatively consistent with the expression difference between lymphomas and controls. The results of the ROC analysis of these marker genes are shown in Figure 3D. The ideal classification effect of marker genes is that they have high sensitivity and specificity in the specific type of lymphoma (the AUC value is close to 1) and have a random effect for the other two lymphomas (the AUC value is close to 0.5). For the HL marker genes, MYH2 showed the highest AUC of 0.901 in HL, a low AUC in DLBCL, and an AUC close to 0.5 in MCL; therefore, it can be used as the optimal model in the single-gene prediction model in HL (Figure 3E). LIPF showed the highest AUC of 0.875 in DLBCL and low AUCs in HL and MCL and is considered to be the optimal single-gene prediction model in DLBCL (Figure 3F). However, IGLV3-19 had the highest AUC in MCL marker genes but only showed a general prediction effect (Figure 3G).
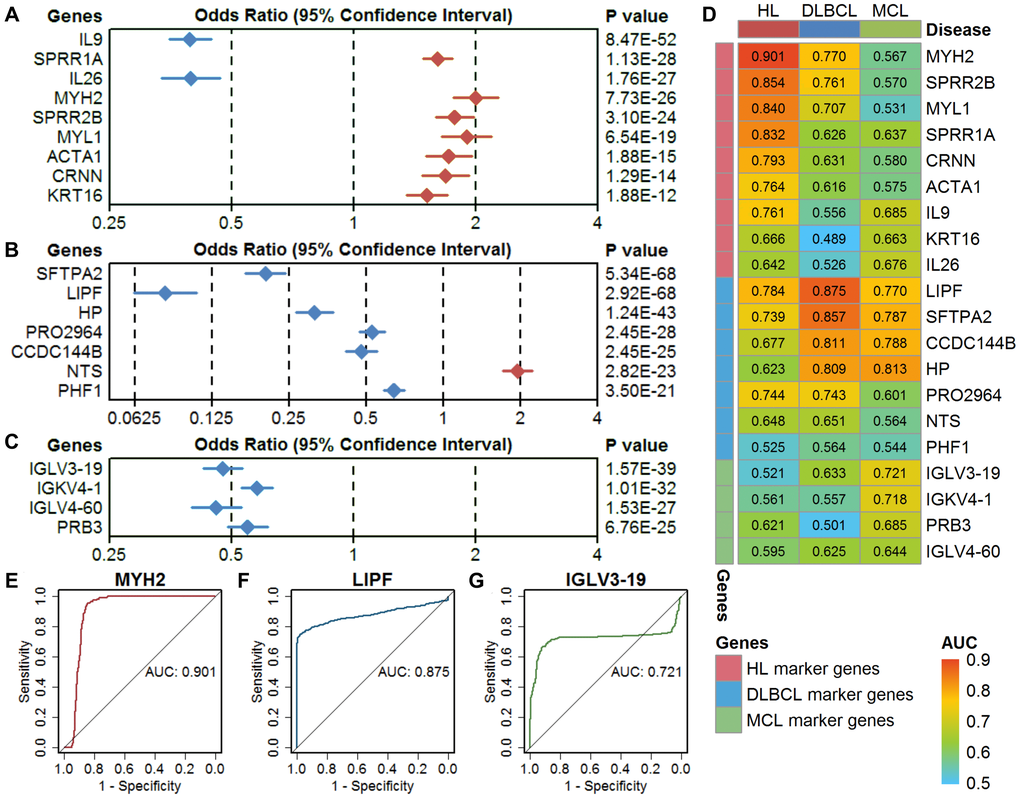
Figure 3. Evaluation of single-gene models in three types of lymphoma. (A–C) The classification performance of HL marker genes, DLBCL marker genes, and MCL marker genes using a univariate logistic regression model. The diamond shape indicates the odds ratio (OR), and the line indicates the 95% confidence interval (CI). The red color indicates OR > 1, and the blue color indicates OR < 1. (D) The area under the curve (AUC) of the marker genes in three types of lymphoma. (E–G) Receiver operating characteristic (ROC) curves of the optimal single-gene model in HL (MYH2), DLBCL (LIPF), and MCL (IGLV3-19). HL, Hodgkin's lymphoma; DLBCL, diffuse large B-cell lymphoma; MCL, mantle cell lymphoma.
Multigene prediction model
The optimal model in HL is MYH2 (Figure 4A and 4G), which had the highest AUC compared with the remaining gene combination models (Figure 4D). The optimal model in DLBCL is the combination of 7 marker genes, including LIPF, CCDC144B, PRO2964, PHF1, SFTPA2, NTS, and HP (Figure 4B and 4G), which had the highest AUC of 0.951 (Figure 4E). The optimal model in MCL is the combination of 3 marker genes, including IGLV3-19, IGKV4-1, and PRB3 (Figure 4C and 4G), which had the highest AUC of 0.843 (Figure 4F). These three optimal models all show high specificity in a certain type of lymphoma and showed relatively poor specificity for the other two types of lymphomas (Supplementary Figure 3). Considering the analyzed gene expression data derived from samples including not only lymphoma cells, but also stroma. We screened the data derived from isolated lymphoma cells and normal B cells (Table 1) and analyzed the expression of the lymphoma marker genes between cases and controls. Despite the small sample size, most marker genes still showed the differential expression consistent with the overall analysis (Supplementary Figure 4). Furthermore, the optimal diagnostic models of these genes showed high prediction accuracy in the data derived from isolated lymphoma cells (Supplementary Figure 5). The dataset of GSE132929 including multiple types of lymphomas (no HL or controls) was used to verify the predictive performance of the above optimal models. Previous studies suggested that it is difficult to distinguish Burkitt's lymphoma (BURL) and DLBCL [30, 31], the DLBCL optimal model showed a high AUC of 0.843 in the validation set with removed BURK (Supplementary Figure 6).
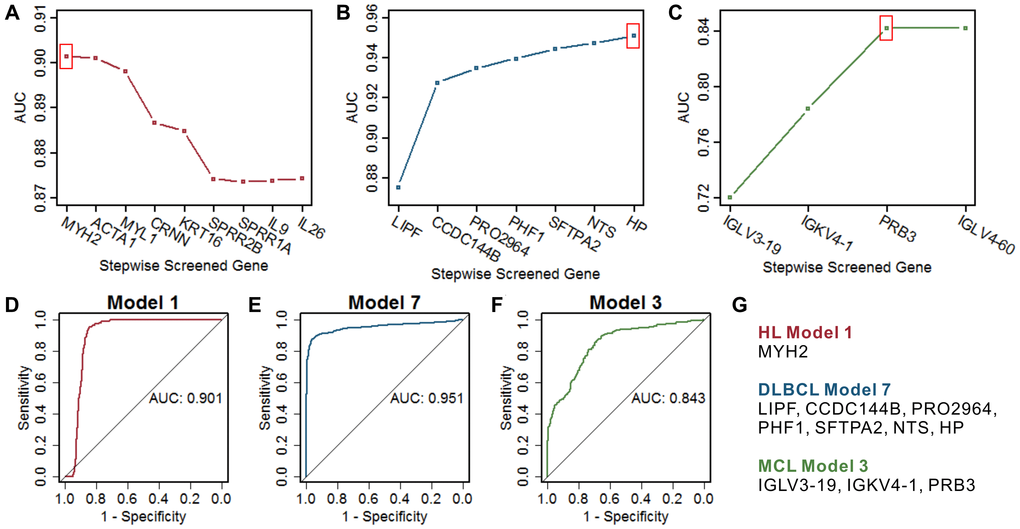
Figure 4. Screening of the optimal multigene prediction model for three lymphomas. (A–C) Stepwise screened multigene prediction models in HL, DLBCL, and MCL. From left to right on the x-axis (stepwise screened genes), each additional gene corresponds to a model [for example, in (A), MYH2 represents model 1, which contains one gene of MYH2, ACTA1 represents model 2, which contains two genes including MYH2 and ACTA1]. The red box shows the optimal model for each type of lymphoma. (D–F) ROC curves of the screened optimal models for each type of lymphoma. (G) Genes in the screened optimal models for three lymphomas. HL, Hodgkin's lymphoma; DLBCL, diffuse large B-cell lymphoma; MCL, mantle cell lymphoma.
Table 1. Information on the datasets of three types of lymphoma.
| GEO ID | Contributor | Samples | Sample type | Platform | |||||||||||||||||||||||||||||||||||||||||||||||||||||||||||||||||||||||||||||||||||||||||||||||
| Hodgkin's lymphoma (HL) | |||||||||||||||||||||||||||||||||||||||||||||||||||||||||||||||||||||||||||||||||||||||||||||||||||
| GSE77881 | Van Loo P, 2007 | 10 cases 1 control | lymph nodes | Affymetrix HG-U133 Plus 2.0 Array (GPL570) | |||||||||||||||||||||||||||||||||||||||||||||||||||||||||||||||||||||||||||||||||||||||||||||||
| GSE124532 | Brune V, 2008 | 17 cases 25 controls | isolated lymphoma cells (case) isolated normal B cells (control) | Affymetrix HG-U133 Plus 2.0 Array (GPL570) | |||||||||||||||||||||||||||||||||||||||||||||||||||||||||||||||||||||||||||||||||||||||||||||||
| GSE13996 | Chetaille B. 2008 | 64 cases | lymph nodes | Affymetrix HG-U133A 2.0 Array (GPL571) | |||||||||||||||||||||||||||||||||||||||||||||||||||||||||||||||||||||||||||||||||||||||||||||||
| GSE17920 | Steidl C, 2009 | 130 cases | lymph nodes | Affymetrix HG-U133 Plus 2.0 Array (GPL570) | |||||||||||||||||||||||||||||||||||||||||||||||||||||||||||||||||||||||||||||||||||||||||||||||
| GSE47044 | Hartmann S, 2013 | 19 cases 5 controls | isolated lymphoma cells (case) isolated normal B cells (control) | Affymetrix Human Gene 1.0 ST Array (GPL6244) | |||||||||||||||||||||||||||||||||||||||||||||||||||||||||||||||||||||||||||||||||||||||||||||||
| Diffuse large B-cell lymphoma (DLBCL) | |||||||||||||||||||||||||||||||||||||||||||||||||||||||||||||||||||||||||||||||||||||||||||||||||||
| GSE124532 | Brune V, 2008 | 11 cases | isolated lymphoma cells | Affymetrix HG-U133 Plus 2.0 Array (GPL570) | |||||||||||||||||||||||||||||||||||||||||||||||||||||||||||||||||||||||||||||||||||||||||||||||
| GSE31312 | Li Y, 2011 | 498 cases | lymphoma tissue | Affymetrix HG-U133 Plus 2.0 Array (GPL570) | |||||||||||||||||||||||||||||||||||||||||||||||||||||||||||||||||||||||||||||||||||||||||||||||
| GSE56315 | Bødker JS, 2014 | 89 cases 33 controls | lymphoma tissue (case) isolated normal B cells (control) | Affymetrix HG-U133 Plus 2.0 Array (GPL570) | |||||||||||||||||||||||||||||||||||||||||||||||||||||||||||||||||||||||||||||||||||||||||||||||
| GSE64555 | Linton K, 2014 | 40 cases | lymphoma tissue | Affymetrix HG-U133 Plus 2.0 Array (GPL570) | |||||||||||||||||||||||||||||||||||||||||||||||||||||||||||||||||||||||||||||||||||||||||||||||
| GSE69053 | Sha C, 2015 | 212 cases | lymphoma tissue | Illumina HumanRef-8 WG-DASL v3.0 (GPL8432) Illumina HumanHT-12 WG-DASL V4.0 (GPL14951) | |||||||||||||||||||||||||||||||||||||||||||||||||||||||||||||||||||||||||||||||||||||||||||||||
| GSE86613 | Bødker JS, 2016 | 41 cases | lymphoma tissue | Affymetrix HG-U133 Plus 2.0 Array (GPL570) | |||||||||||||||||||||||||||||||||||||||||||||||||||||||||||||||||||||||||||||||||||||||||||||||
| Mantle cell lymphoma (MCL) | |||||||||||||||||||||||||||||||||||||||||||||||||||||||||||||||||||||||||||||||||||||||||||||||||||
| GSE21452 | Staudt LM, 2010 | 64 cases | lymph nodes | Affymetrix HG-U133 Plus 2.0 Array (GPL570) | |||||||||||||||||||||||||||||||||||||||||||||||||||||||||||||||||||||||||||||||||||||||||||||||
| GSE36000 | Jares P, 2012 | 38 cases | isolated lymphoma cells | Affymetrix HG-U133 Plus 2.0 Array (GPL570) | |||||||||||||||||||||||||||||||||||||||||||||||||||||||||||||||||||||||||||||||||||||||||||||||
| GSE70910 | Liu D, 2015 | 55 cases | lymph nodes, peripheral blood | Affymetrix HG-U133 Plus 2.0 Array (GPL570) | |||||||||||||||||||||||||||||||||||||||||||||||||||||||||||||||||||||||||||||||||||||||||||||||
| GSE93291 | Staudt LM, 2017 | 59 cases | lymph nodes | Affymetrix HG-U133 Plus 2.0 Array (GPL570) | |||||||||||||||||||||||||||||||||||||||||||||||||||||||||||||||||||||||||||||||||||||||||||||||
| 1The one control sample in this study was the mixed five control samples. | |||||||||||||||||||||||||||||||||||||||||||||||||||||||||||||||||||||||||||||||||||||||||||||||||||
| 2This dataset included 17 HL samples, 11 DLBCL samples, and 25 controls. The number of control samples was shown in the HL group and was not repeated in the DLBCL group. | |||||||||||||||||||||||||||||||||||||||||||||||||||||||||||||||||||||||||||||||||||||||||||||||||||
Discussion
Accurate and effective diagnosis is critical to the appropriate treatment of lymphoma. Although many new techniques are used for the diagnosis of lymphoma, such as immunohistochemical tests, flow cytometry, cytogenetic, and other molecular biology techniques [32], the most effective diagnostic strategy is still tissue biopsy [33]. Given that some genes show extremely high mutation frequencies in certain types of lymphoma, using a single-gene mutation or a combination of mutations may accurately diagnose few types of lymphomas [34]. However, the diagnosis of most lymphomas using genetic mutations may not achieve the desired accuracy. Previous transcriptome studies have revealed that there are a large number of abnormally expressed genes in different types of lymphomas compared with normal tissues [29, 35–37]. These highly differential genes may be used as diagnostic and prognostic markers for lymphomas [38]. The difference in clinical treatment and prognosis of B-cell-derived lymphoma is correlated to its molecular heterogeneity. In this study, lymphoma marker genes and specific diagnostic models are proposed, which are helpful to improve the diagnosis accuracy of HL, DLBCL, and MCL. These results indicate that there are certain differences at the molecular level among HL, DLBCL, and MCL, which provides some insights for the molecular diagnosis and prognosis assessment of these three types of lymphomas.
Gene expression profiling has broad application prospects in tumor diagnosis [39], and numerous novel biomarkers have been identified in the most common types of B-cell, T-cell, and NK-cell lymphomas [40]. Multiple diagnostic models based on the combined effects of tumor biomarkers have been developed and show high prediction accuracy. A previous report constructed two logistic regression models based on mammography features and demographic data; both of these models showed high accuracy for breast cancer diagnosis [41]. A logistic regression model integrating transcriptome and clinical data also showed high diagnostic accuracy in lung cancer [42]. Furthermore, using machine learning methods to construct tumor diagnostic models is also an effective strategy. Diagnostic models based on support vector machines and their derived methods by feature extraction of transcriptome data exhibited high prediction accuracy in multiple cancer datasets [43, 44]. The sample size is an important factor affecting the accuracy of the diagnostic model [45]. In this study, the sample size of DLBCL is relatively large, while the sample size of HL and MCL is relatively small, and the final multigene diagnosis models also showed the highest diagnostic accuracy for DLBCL. In future work, a larger sample size can be used to develop more accurate tumor-specific diagnosis or prognosis models. With the expansion of the sample size, it is expected to be further upgraded to a personalized prediction model.
The screened HL marker genes were mainly involved in actin- and cytoskeleton-related functions. Multiple studies showed that the actin cytoskeleton plays a crucial role in aging and apoptosis [46], and the dysfunction of the actin cytoskeleton correlated to many age-related diseases, such as cancer [47]. Actin polymerization and actin-myosin interactions directly drive the movement and migration of lymphocytes [48]. A proteomics study showed that several upregulated proteins were involved in the regulation of the cytoskeleton and/or cell migration in HL [49]. Inhibited cytoskeleton-related proteins promoted the differentiation of Hodgkin's and Reed-Sternberg (H/RS) cells toward terminal B-cells in HL cell lines [50]. DLBCL marker genes were mostly enriched in chromatin modification and regulation processes. Increased variations in chromatin modification were correlated with aging [51], studies showed that these epigenetic factors can also induce tumorigenesis [52]. Mutations in chromatin modification-related genes are correlated to gene expression profiles and clinical outcomes in DLBCL [53]. These genes can be used as signatures for evaluating the effect of medical treatments on DLBCL [54, 55]. Several immunoglobulin (Ig) subunit genes were chosen as MCL marker genes in this study. Alterations in IgG glycosylation patterns have been observed in aging and various cancers [56]. The regulation and modification of Ig are essential to maintain immune homeostasis in vivo [56]. The imbalanced Ig heavy and light chain stereotypy was found in MCL [57].
The above reports indicated that the marker genes screened in this study correlated with the specific biological changes of different lymphomas. Furthermore, these marker genes also showed high diagnostic accuracy in other tumors and correlated with tumorigenesis and prognosis. A previous study showed that MYH2 was correlated with multiple prognostic factors in lymph-node-negative primary breast cancer [58]. Downregulated IL26 promotes anaplastic large cell lymphoma cell growth and survival [59]. Gastric lipase (LIPF) is highly expressed in the normal stomach and showed significantly low expression in gastric adenocarcinoma, suggesting that it can be used as a diagnostic and prognostic indicator for gastric cancer [60, 61]. Low expression of PRB3 was found to be associated with tumor recurrence in prolactinomas [62] and salivary gland acinic cell carcinoma [63]. Besides, there are several representative markers associated with each subtype, such as CD15, CD30, CD45, and PD-L1 for HL [10], CD5, MYC, BCL2, and BCL6 for DLBCL [9], and CCND1, CD5, and SOX11 for MCL [7]. However, most of these genes did not meet the differential expression screening criteria. Therefore, these genes are not included in the specific markers screened in this study.
In conclusion, screening for tumor-specific biomarkers requires the rigorous consideration of differences between tumor and normal cells as well as the differences among different tumors or subtypes. The present study provides the transcriptome data-based reference markers, which may help the diagnosis of HL, DLBCL, and MCL when combined with other clinical markers. As there are multiple subtypes of lymphoma according to the WHO classification, whether the currently obtained marker genes can be used to diagnose other types of lymphomas requires further research. One potential shortcoming in this study is the sample size of different lymphoma datasets varies largely, especially for the control group is relatively low. The present study provides a molecular diagnostic method, a reference for tumor diagnosis with a subtle difference to clarify tumor subtypes.
Materials and Methods
Lymphoma dataset collection
Transcriptome datasets of HL, DLBCL, and MCL were downloaded from the Gene Expression Omnibus (GEO) database (https://www.ncbi.nlm.nih.gov/geo/). The dataset selection criteria were as follows: (1) all datasets were genome-wide; (2) the number of samples in each dataset must be ≥ 10; (3) all samples were non-cell-line samples; and (4) complete microarray data (raw or normalized) were available. If a dataset contained any of the following items, it was excluded: (1) the number of samples was less than 3 for cases or controls; (2) the samples were treated with drugs or other agents; and (3) serious RNA degradation or the number of detected genes was too small. Based on the above criteria, 14 datasets were chosen for the integrated analysis (GSE12453, GSE13996, GSE17920, GSE21452, GSE31312, GSE36000, GSE47044, GSE56315, GSE64555, GSE69053, GSE70910, GSE7788, GSE86613 and GSE93291). The sample type of most data is lymphoma tissue, only a small part of the data derived from isolated lymphoma cells, the details of these datasets are provided in Table 1. In total, the collected datasets contained 240 HL samples, 891 DLBCL samples, 216 MCL samples, and 64 healthy samples.
Data preprocessing
R statistical software v3.3.3 (https://www.r-project.org/) was used to perform data preprocessing. Because these datasets contain different microarray platforms, they were grouped into 15 batches according to the study and platform. Each batch contained only one study and one platform (Supplementary Table 4). Gene annotation, integration, and renormalization of the 15 batches were carried out using custom-designed Python code. The method and scripts are detailed in our previous publications [64, 65]. Because there were missing values for genes in a few samples, the mean expression value of these genes in the whole sample was used to replace the missing data. Fortunately, the missing values had little effect on the data (Supplementary Figure 7). After global renormalization, the distribution of gene expression values across all studies had a consistent range (Supplementary Figure 8). Heatmap in the pheatmap package in R was used to show all gene expression profiles in the integrated and the global renormalized datasets. The method of unsupervised clustering was chosen as "ward.D". There was a strong batch effect in the integrated datasets, and this batch effect has been mostly eliminated in the global renormalized datasets (Supplementary Figure 9).
Differential expression analysis
Differential gene expression analysis was performed using the empirical Bayesian algorithm in the limma package in R [66]. Up- and downregulated genes were defined as a log2 transformed fold-change (logFC) ≥ 1 or ≤ -1 for lymphoma samples compared with controls. Because the difference between lymphoma groups was smaller than the difference between lymphoma samples and controls, the fold-change cutoff was set as 1.2. A false discovery rate (FDR)-corrected P-value ≤ 0.05 was considered significant.
Screening of lymphoma marker genes
Lymphoma-specific genes were defined as the intersection of specific differentially expressed genes in lymphoma samples compared to controls and the common intergroup differentially expressed genes in different lymphoma groups. For example, the filtered HL-specific genes are differentially expressed between HL vs. control with no difference in DLBCL vs. control or MCL vs. control and are differentially expressed between HL vs. DLBCL and HL vs. MCL. To ensure that the screened marker genes have a relatively large differential expression compared to other types of lymphoma, the lymphoma marker genes were defined as lymphoma-specific genes with a mean absolute value of intergroup fold-change ≥ 0.5.
Gene-gene interaction analysis
Considering that the gene-gene interactions between the screened marker genes and other genes may affect prediction accuracy, Pearson correlation analysis was used to calculate the correlation coefficient between each marker gene and all other genes. An FDR corrected P-value ≤ 0.05 was considered significantly correlated. A multiple logistic regression model was used to analyze the effect of each marker gene on the corresponding lymphoma. The top 10 significantly correlated genes (filtered by significance) were used as covariates for model correction.
GO enrichment analysis
The information on human genes and related GO biological functions were downloaded from the QuickGO database (http://www.ebi.ac.uk/QuickGO-Beta/). GO enrichment analysis was performed using a hypergeometric test and the formula shown in a previous report [67]. An FDR corrected P-value ≤ 0.05 was considered significantly enriched.
Functional interaction analysis
The GeneMANIA application [68] in Cytoscape v3.4.0 was used to perform functional interaction analysis of marker genes in three types of lymphoma. The interaction networks were built with the default parameter settings. The application predicts 20 query genes that are correlated to the input genes and generate a functional association network based on their relationships. The functional enrichment results of the genes in the network were automatically generated, and an FDR-corrected P-value ≤ 0.05 was considered significantly enriched.
Prognostic analysis
Two datasets (GSE17920 and GSE31312) had prognostic information. The GSE17920 dataset (HL) contains multiple prognostic indicators but no survival data, and the GSE31312 dataset (DLBCL) contains complete overall and progression-free survival information. The difference in HL marker genes regarding prognostic indicators was determined using Student’s t-test. Survival analysis was conducted using the survival package in R. The effects of DLBCL marker genes on overall and progression-free survival were assessed using Kaplan–Meier survival curves.
Single-gene and multigene prediction models
The single-gene prediction model and the multigene prediction model were built using the lymphoma marker genes. A univariate logistic regression model was used to calculate the odds ratios of the screened lymphoma marker genes in each type of lymphoma. For the single-gene prediction models, the specified type of lymphoma was classified as "case", whereas the healthy samples and the other two types of lymphomas were classified as "control". The receiver operating characteristic (ROC) curve and the area under the curve (AUC) of the single marker genes were calculated using the pROC package in R. The model with the largest AUC was defined as the optimal model. A stepwise modeling strategy was used to screen the optimal multigene combination models for each type of lymphoma. First, a gene with the largest AUC was selected. Then, we used a multivariate logistic regression model to generate the combined effect of the selected gene and each of the remaining genes. Next, we selected the best two-gene model with the highest AUC and repeated the previous steps. Finally, we selected the optimal model with the highest AUC in each multigene combination model.
Author Contributions
DL, JFH, FL, and WXL designed the study. WXL, SXD, SQA, JL, LGL, YX, and HY, collected the data. WXL, SXD, SQA, TTS, JW, LXF, XLZ, WQL, JFH, and DL designed the method and analyzed the data. WXL, SXD, SQA, TTS, HY, LT, FL, JFH, and DL wrote the manuscript. WXL, FL, JFH, and DL supervised the research, interpreted the data, and revised the manuscript. All authors read and approved the submitted version.
Conflicts of Interest
The authors declare that they have no conflicts of interest.
Funding
This work was supported by the National Key Research and Development Program (No. 2018YFA0902702), the National Science and Technology Major Project (No. 2018ZX10731301-003-007), the National Natural Science Foundation of China (No. 81570376, No. 81870307, No. 81570202), the Scientific Research Startup Fund of Foshan University (Grant No. CGZ07001), the University Special Innovative Research Program of Department of Education of Guangdong Province (No. 2017KTSCX189) and the Yunnan Fundamental Research Projects (grant NO. 2019FB050).
References
- 1. Pinto A, De Filippi R, Frigeri F, Corazzelli G, Normanno N. Aging and the hemopoietic system. Crit Rev Oncol Hematol. 2003 (Suppl); 48:S3–S12. https://doi.org/10.1016/j.critrevonc.2003.06.006 [PubMed]
- 2. Sarkozy C, Salles G, Falandry C. The biology of aging and lymphoma: a complex interplay. Curr Oncol Rep. 2015; 17:32. https://doi.org/10.1007/s11912-015-0457-x [PubMed]
- 3. Zhou X, Fang X, Jiang Y, Geng L, Li X, Li Y, Lu K, Li P, Lv X, Wang X. Klotho, an anti-aging gene, acts as a tumor suppressor and inhibitor of IGF-1R signaling in diffuse large B cell lymphoma. J Hematol Oncol. 2017; 10:37. https://doi.org/10.1186/s13045-017-0391-5 [PubMed]
- 4. Hartmann K, Illing A, Leithauser F, Baisantry A, Quintanilla-Martinez L, Rudolph KL. Gene dosage reductions of Trf1 and/or Tin2 induce telomere DNA damage and lymphoma formation in aging mice. Leukemia. 2016; 30:749–53. https://doi.org/10.1038/leu.2015.173 [PubMed]
- 5. Quintanilla-Martinez L. The 2016 updated WHO classification of lymphoid neoplasias. Hematol Oncol. 2017 (Suppl 1); 35:37–45. https://doi.org/10.1002/hon.2399 [PubMed]
- 6. Teras LR, DeSantis CE, Cerhan JR, Morton LM, Jemal A, Flowers CR. 2016 US lymphoid malignancy statistics by World Health Organization subtypes. CA Cancer J Clin. 2016; 66:443–59. https://doi.org/10.3322/caac.21357 [PubMed]
- 7. Cheah CY, Seymour JF, Wang ML. Mantle Cell Lymphoma. J Clin Oncol. 2016; 34:1256–69. https://doi.org/10.1200/JCO.2015.63.5904 [PubMed]
- 8. Ansell SM. Hodgkin Lymphoma: Diagnosis and Treatment. Mayo Clin Proc. 2015; 90:1574–83. https://doi.org/10.1016/j.mayocp.2015.07.005 [PubMed]
- 9. Li S, Young KH, Medeiros LJ. Diffuse large B-cell lymphoma. Pathology. 2018; 50:74–87. https://doi.org/10.1016/j.pathol.2017.09.006 [PubMed]
- 10. Shanbhag S, Ambinder RF. Hodgkin lymphoma: A review and update on recent progress. CA Cancer J Clin. 2018; 68:116–32. https://doi.org/10.3322/caac.21438 [PubMed]
- 11. Jain P, Wang M. Mantle cell lymphoma: 2019 update on the diagnosis, pathogenesis, prognostication, and management. Am J Hematol. 2019; 94:710–25. https://doi.org/10.1002/ajh.25487 [PubMed]
- 12. Dave SS, Fu K, Wright GW, Lam LT, Kluin P, Boerma EJ, Greiner TC, Weisenburger DD, Rosenwald A, Ott G, Muller-Hermelink HK, Gascoyne RD, Delabie J, et al, and Lymphoma/Leukemia Molecular Profiling Project. Molecular diagnosis of Burkitt's lymphoma. N Engl J Med. 2006; 354:2431–42. https://doi.org/10.1056/NEJMoa055759 [PubMed]
- 13. Mulazzani M, Huber M, Borchard S, Langer S, Angele B, Schuh E, Meinl E, Dreyling M, Birnbaum T, Straube A, Koedel U, von Baumgarten L. APRIL and BAFF: novel biomarkers for central nervous system lymphoma. J Hematol Oncol. 2019; 12:102. https://doi.org/10.1186/s13045-019-0796-4 [PubMed]
- 14. Agostinelli C, Akarca AU, Ramsay A, Rizvi H, Rodriguez-Justo M, Pomplun S, Proctor I, Sabattini E, Linch D, Daw S, Pittaluga S, Pileri SA, Jaffe ES, et al. Novel markers in pediatric-type follicular lymphoma. Virchows Arch. 2019; 475:771–79. https://doi.org/10.1007/s00428-019-02681-y [PubMed]
- 15. Fujii K, Kanekura T. Next-Generation Sequencing Technologies for Early-Stage Cutaneous T-Cell Lymphoma. Front Med (Lausanne). 2019; 6:181. https://doi.org/10.3389/fmed.2019.00181 [PubMed]
- 16. Tan KM, Chia B, Lim JQ, Khoo LP, Cheng CL, Tan L, Poon E, Somasundaram N, Farid M, Tang TPL, Tao M, Cheah DMZ, Laurensia Y, et al. A clinicohaematological prognostic model for nasal-type natural killer/T-cell lymphoma: A multicenter study. Sci Rep. 2019; 9:14961. https://doi.org/10.1038/s41598-019-51522-0 [PubMed]
- 17. Greaves P, Clear A, Coutinho R, Wilson A, Matthews J, Owen A, Shanyinde M, Lister TA, Calaminici M, Gribben JG. Expression of FOXP3, CD68, and CD20 at diagnosis in the microenvironment of classical Hodgkin lymphoma is predictive of outcome. J Clin Oncol. 2013; 31:256–62. https://doi.org/10.1200/JCO.2011.39.9881 [PubMed]
- 18. Porrata LF, Ristow K, Colgan JP, Habermann TM, Witzig TE, Inwards DJ, Ansell SM, Micallef IN, Johnston PB, Nowakowski GS, Thompson C, Markovic SN. Peripheral blood lymphocyte/monocyte ratio at diagnosis and survival in classical Hodgkin's lymphoma. Haematologica. 2012; 97:262–69. https://doi.org/10.3324/haematol.2011.050138 [PubMed]
- 19. Jardin F, Figeac M. MicroRNAs in lymphoma, from diagnosis to targeted therapy. Curr Opin Oncol. 2013; 25:480–86. https://doi.org/10.1097/CCO.0b013e328363def2 [PubMed]
- 20. Abeel T, Helleputte T, Van de Peer Y, Dupont P, Saeys Y. Robust biomarker identification for cancer diagnosis with ensemble feature selection methods. Bioinformatics. 2010; 26:392–98. https://doi.org/10.1093/bioinformatics/btp630 [PubMed]
- 21. Jiang JX, Yu C, Li ZP, Xiao J, Zhang H, Chen MY, Sun CY. Insights into significant pathways and gene interaction networks in peripheral blood mononuclear cells for early diagnosis of hepatocellular carcinoma. J Cancer Res Ther. 2016; 12:981–89. https://doi.org/10.4103/0973-1482.154081 [PubMed]
- 22. Lv WW, Liu D, Liu XC, Feng TN, Li L, Qian BY, Li WX. Effects of PKM2 on global metabolic changes and prognosis in hepatocellular carcinoma: from gene expression to drug discovery. BMC Cancer. 2018; 18:1150. https://doi.org/10.1186/s12885-018-5023-0 [PubMed]
- 23. Yao J, Caballero OL, Yung WKA, Weinstein JN, Riggins GJ, Strausberg RL, Zhao Q. Tumor subtype-specific cancer-testis antigens as potential biomarkers and immunotherapeutic targets for cancers. Cancer Immunol Res. 2014; 2:371–79. https://doi.org/10.1158/2326-6066.CIR-13-0088 [PubMed]
- 24. Bramsen JB, Rasmussen MH, Ongen H, Mattesen TB, Ørntoft MB, Árnadóttir SS, Sandoval J, Laguna T, Vang S, Øster B, Lamy P, Madsen MR, Laurberg S, et al. Molecular-Subtype-Specific Biomarkers Improve Prediction of Prognosis in Colorectal Cancer. Cell Rep. 2017; 19:1268–80. https://doi.org/10.1016/j.celrep.2017.04.045 [PubMed]
- 25. Ceccarelli M, Barthel FP, Malta TM, Sabedot TS, Salama SR, Murray BA, Morozova O, Newton Y, Radenbaugh A, Pagnotta SM, Anjum S, Wang J, Manyam G, et al, and TCGA Research Network. Molecular Profiling Reveals Biologically Discrete Subsets and Pathways of Progression in Diffuse Glioma. Cell. 2016; 164:550–63. https://doi.org/10.1016/j.cell.2015.12.028 [PubMed]
- 26. Lynch RC, Gratzinger D, Advani RH. Clinical Impact of the 2016 Update to the WHO Lymphoma Classification. Curr Treat Options Oncol. 2017; 18:45. https://doi.org/10.1007/s11864-017-0483-z [PubMed]
- 27. Van Loo P, Tousseyn T, Vanhentenrijk V, Dierickx D, Malecka A, Vanden Bempt I, Verhoef G, Delabie J, Marynen P, Matthys P, De Wolf-Peeters C. T-cell/histiocyte-rich large B-cell lymphoma shows transcriptional features suggestive of a tolerogenic host immune response. Haematologica. 2010; 95:440–48. https://doi.org/10.3324/haematol.2009.009647 [PubMed]
- 28. Brune V, Tiacci E, Pfeil I, Doring C, Eckerle S, van Noesel CJM, Klapper W, Falini B, von Heydebreck A, Metzler D, Brauninger A, Hansmann ML, Kuppers R. Origin and pathogenesis of nodular lymphocyte-predominant Hodgkin lymphoma as revealed by global gene expression analysis. J Exp Med. 2008; 205:2251–68. https://doi.org/10.1084/jem.20080809 [PubMed]
- 29. Yang AP, Liu LG, Chen MM, Liu F, You H, Liu L, Yang H, Xun Y, Liu J, Wang RX, Brand DD, Liu DH, Zheng SG, Li WX. Integrated analysis of 10 lymphoma datasets identifies E2F8 as a key regulator in Burkitt's lymphoma and mantle cell lymphoma. Am J Transl Res. 2019; 11:4382–96. [PubMed]
- 30. Bellan C, Stefano L, Giulia De F, Rogena EA, Lorenzo L. Burkitt lymphoma versus diffuse large B-cell lymphoma: a practical approach. Hematol Oncol. 2009; 27:182–85. https://doi.org/10.1002/hon.914 [PubMed]
- 31. Ott G. Aggressive B-cell lymphomas in the update of the 4th edition of the World Health Organization classification of haematopoietic and lymphatic tissues: refinements of the classification, new entities and genetic findings. Br J Haematol. 2017; 178:871–87. https://doi.org/10.1111/bjh.14744 [PubMed]
- 32. Li X. Pitfalls in the pathological diagnosis of lymphoma. Chin Clin Oncol. 2015; 4:3. https://doi.org/10.3978/j.issn.2304-3865.2014.11.04 [PubMed]
- 33. Matasar MJ, Zelenetz AD. Overview of lymphoma diagnosis and management. Radiol Clin North Am. 2008; 46:175–98, vii. [PubMed]
- 34. Rosenquist R, Rosenwald A, Du MQ, Gaidano G, Groenen P, Wotherspoon A, Ghia P, Gaulard P, Campo E, Stamatopoulos K, and European Research Initiative on CLL (ERIC) and the European Association for Haematopathology (EAHP). Clinical impact of recurrently mutated genes on lymphoma diagnostics: state-of-the-art and beyond. Haematologica. 2016; 101:1002–09. https://doi.org/10.3324/haematol.2015.134510 [PubMed]
- 35. Steidl C, Lee T, Shah SP, Farinha P, Han G, Nayar T, Delaney A, Jones SJ, Iqbal J, Weisenburger DD, Bast MA, Rosenwald A, Muller-Hermelink HK, et al. Tumor-associated macrophages and survival in classic Hodgkin's lymphoma. N Engl J Med. 2010; 362:875–85. https://doi.org/10.1056/NEJMoa0905680 [PubMed]
- 36. Visco C, Li Y, Xu-Monette ZY, Miranda RN, Green TM, Li Y, Tzankov A, Wen W, Liu WM, Kahl BS, d'Amore ES, Montes-Moreno S, Dybkær K, et al. Comprehensive gene expression profiling and immunohistochemical studies support application of immunophenotypic algorithm for molecular subtype classification in diffuse large B-cell lymphoma: a report from the International DLBCL Rituximab-CHOP Consortium Program Study. Leukemia. 2012; 26:2103–13. https://doi.org/10.1038/leu.2012.83 [PubMed]
- 37. Hartmann EM, Campo E, Wright G, Lenz G, Salaverria I, Jares P, Xiao W, Braziel RM, Rimsza LM, Chan WC, Weisenburger DD, Delabie J, Jaffe ES, et al. Pathway discovery in mantle cell lymphoma by integrated analysis of high-resolution gene expression and copy number profiling. Blood. 2010; 116:953–61. https://doi.org/10.1182/blood-2010-01-263806 [PubMed]
- 38. Jamil MO, Mehta A. Diffuse Large B-cell lymphoma: Prognostic markers and their impact on therapy. Expert Rev Hematol. 2016; 9:471–77. https://doi.org/10.1586/17474086.2016.1146584 [PubMed]
- 39. Ramaswamy S, Tamayo P, Rifkin R, Mukherjee S, Yeang CH, Angelo M, Ladd C, Reich M, Latulippe E, Mesirov JP, Poggio T, Gerald W, Loda M, et al. Multiclass cancer diagnosis using tumor gene expression signatures. Proc Natl Acad Sci U S A. 2001; 98:15149–54. https://doi.org/10.1073/pnas.211566398 [PubMed]
- 40. Sun R, Medeiros LJ, Young KH. Diagnostic and predictive biomarkers for lymphoma diagnosis and treatment in the era of precision medicine. Mod Pathol. 2016; 29:1118–42. https://doi.org/10.1038/modpathol.2016.92 [PubMed]
- 41. Chhatwal J, Alagoz O, Lindstrom MJ, Kahn CE
Jr , Shaffer KA, Burnside ES. A logistic regression model based on the national mammography database format to aid breast cancer diagnosis. AJR Am J Roentgenol. 2009; 192:1117–27. https://doi.org/10.2214/AJR.07.3345 [PubMed] - 42. Beane J, Sebastiani P, Whitfield TH, Steiling K, Dumas YM, Lenburg ME, Spira A. A prediction model for lung cancer diagnosis that integrates genomic and clinical features. Cancer Prev Res (Phila). 2008; 1:56–64. https://doi.org/10.1158/1940-6207.CAPR-08-0011 [PubMed]
- 43. Statnikov A, Aliferis CF, Tsamardinos I, Hardin D, Levy S. A comprehensive evaluation of multicategory classification methods for microarray gene expression cancer diagnosis. Bioinformatics. 2005; 21:631–43. https://doi.org/10.1093/bioinformatics/bti033 [PubMed]
- 44. Huang CL, Liao HC, Chen MC. Prediction model building and feature selection with support vector machines in breast cancer diagnosis. Expert Syst Appl. 2008; 34:578–87. https://doi.org/10.1016/j.eswa.2006.09.041
- 45. Hajian-Tilaki K. Sample size estimation in diagnostic test studies of biomedical informatics. J Biomed Inform. 2014; 48:193–204. https://doi.org/10.1016/j.jbi.2014.02.013 [PubMed]
- 46. Gourlay CW, Ayscough KR. A role for actin in aging and apoptosis. Biochem Soc Trans. 2005; 33:1260–64. [PubMed]
- 47. Lai WF, Wong WT. Roles of the actin cytoskeleton in aging and age-associated diseases. Ageing Res Rev. 2020; 58:101021. https://doi.org/10.1016/j.arr.2020.101021 [PubMed]
- 48. Lu X, Kazmierczak K, Jiang X, Jones M, Watt J, Helfman DM, Moore JR, Szczesna-Cordary D, Lossos IS. Germinal center-specific protein human germinal center associated lymphoma directly interacts with both myosin and actin and increases the binding of myosin to actin. FEBS J. 2011; 278:1922–31. https://doi.org/10.1111/j.1742-4658.2011.08109.x [PubMed]
- 49. Vergara D, Simeone P, De Matteis S, Carloni S, Lanuti P, Marchisio M, Miscia S, Rizzello A, Napolitano R, Agostinelli C, Maffia M. Comparative proteomic profiling of Hodgkin lymphoma cell lines. Mol Biosyst. 2016; 12:219–32. https://doi.org/10.1039/c5mb00654f [PubMed]
- 50. Jian W, Zhong L, Wen J, Tang Y, Qiu B, Wu Z, Yan J, Zhou X, Zhao T. SEPTIN2 and STATHMIN Regulate CD99-Mediated Cellular Differentiation in Hodgkin's Lymphoma. PLoS One. 2015; 10:e0127568. https://doi.org/10.1371/journal.pone.0127568 [PubMed]
- 51. Cheung P, Vallania F, Warsinske HC, Donato M, Schaffert S, Chang SE, Dvorak M, Dekker CL, Davis MM, Utz PJ, Khatri P, Kuo AJ. Single-Cell Chromatin Modification Profiling Reveals Increased Epigenetic Variations with Aging. Cell. 2018; 173:1385–97.e14. https://doi.org/10.1016/j.cell.2018.03.079 [PubMed]
- 52. Perez RF, Tejedor JR, Bayon GF, Fernandez AF, Fraga MF. Distinct chromatin signatures of DNA hypomethylation in aging and cancer. Aging Cell. 2018; 17:e12744. https://doi.org/10.1111/acel.12744 [PubMed]
- 53. Zhang J, Grubor V, Love CL, Banerjee A, Richards KL, Mieczkowski PA, Dunphy C, Choi W, Au WY, Srivastava G, Lugar PL, Rizzieri DA, Lagoo AS, et al. Genetic heterogeneity of diffuse large B-cell lymphoma. Proc Natl Acad Sci U S A. 2013; 110:1398–403. https://doi.org/10.1073/pnas.1205299110 [PubMed]
- 54. Cortiguera MG, Garcia-Gaipo L, Wagner SD, Leon J, Batlle-Lopez A, Delgado MD. Suppression of BCL6 function by HDAC inhibitor mediated acetylation and chromatin modification enhances BET inhibitor effects in B-cell lymphoma cells. Sci Rep. 2019; 9:16495. https://doi.org/10.1038/s41598-019-52714-4 [PubMed]
- 55. Ennishi D, Jiang A, Boyle M, Collinge B, Grande BM, Ben-Neriah S, Rushton C, Tang J, Thomas N, Slack GW, Farinha P, Takata K, Miyata-Takata T, et al. Double-Hit Gene Expression Signature Defines a Distinct Subgroup of Germinal Center B-Cell-Like Diffuse Large B-Cell Lymphoma. J Clin Oncol. 2019; 37:190–201. https://doi.org/10.1200/JCO.18.01583 [PubMed]
- 56. Gudelj I, Lauc G, Pezer M. Immunoglobulin G glycosylation in aging and diseases. Cell Immunol. 2018; 333:65–79. https://doi.org/10.1016/j.cellimm.2018.07.009 [PubMed]
- 57. Pighi C, Barbi S, Bertolaso A, Zamo A. Mantle cell lymphoma cell lines show no evident immunoglobulin heavy chain stereotypy but frequent light chain stereotypy. Leuk Lymphoma. 2013; 54:1747–55. https://doi.org/10.3109/10428194.2012.758843 [PubMed]
- 58. Wang Y, Klijn JGM, Zhang Y, Sieuwerts AM, Look MP, Yang F, Talantov D, Timmermans M, Meijer-van Gelder ME, Yu J, Jatkoe T, Berns EM, Atkins D, Foekens JA. Gene-expression profiles to predict distant metastasis of lymph-node-negative primary breast cancer. Lancet. 2005; 365:671–79. https://doi.org/10.1016/S0140-6736(05)17947-1 [PubMed]
- 59. Schleussner N, Merkel O, Costanza M, Liang HC, Hummel F, Romagnani C, Durek P, Anagnostopoulos I, Hummel M, Johrens K, Niedobitek A, Griffin PR, Piva R, et al. The AP-1-BATF and -BATF3 module is essential for growth, survival and TH17/ILC3 skewing of anaplastic large cell lymphoma. Leukemia. 2018; 32:1994–2007. https://doi.org/10.1038/s41375-018-0045-9 [PubMed]
- 60. Imielinski M, Guo G, Meyerson M. Insertions and Deletions Target Lineage-Defining Genes in Human Cancers. Cell. 2017; 168:460–72.e14. https://doi.org/10.1016/j.cell.2016.12.025 [PubMed]
- 61. Kong Y, Zheng Y, Jia Y, Li P, Wang Y. Decreased LIPF expression is correlated with DGKA and predicts poor outcome of gastric cancer. Oncol Rep. 2016; 36:1852–60. https://doi.org/10.3892/or.2016.4989 [PubMed]
- 62. Wang F, Gao H, Li C, Bai J, Lu R, Cao L, Wu Y, Hong L, Wu Y, Lan X, Zhang Y. Low levels of PRB3 mRNA are associated with dopamine-agonist resistance and tumor recurrence in prolactinomas. J Neurooncol. 2014; 116:83–88. https://doi.org/10.1007/s11060-013-1276-2 [PubMed]
- 63. Barasch N, Gong X, Kwei KA, Varma S, Biscocho J, Qu K, Xiao N, Lipsick JS, Pelham RJ, West RB, Pollack JR. Recurrent rearrangements of the Myb/SANT-like DNA-binding domain containing 3 gene (MSANTD3) in salivary gland acinic cell carcinoma. PLoS One. 2017; 12:e0171265. https://doi.org/10.1371/journal.pone.0171265 [PubMed]
- 64. Li WX, Dai SX, Liu JQ, Wang Q, Li GH, Huang JF. Integrated Analysis of Alzheimer’s Disease and Schizophrenia Dataset Revealed Different Expression Pattern in Learning and Memory. J Alzheimers Dis. 2016; 51:417–25. https://doi.org/10.3233/JAD-150807 [PubMed]
- 65. Li WX, Dai SX, Wang Q, Guo YC, Hong Y, Zheng JJ, Liu JQ, Liu D, Li GH, Huang JF. Integrated analysis of ischemic stroke datasets revealed sex and age difference in anti-stroke targets. PeerJ. 2016; 4:e2470. https://doi.org/10.7717/peerj.2470 [PubMed]
- 66. Ritchie ME, Phipson B, Wu D, Hu Y, Law CW, Shi W, Smyth GK. limma powers differential expression analyses for RNA-sequencing and microarray studies. Nucleic Acids Res. 2015; 43:e47. https://doi.org/10.1093/nar/gkv007 [PubMed]
- 67. Liu HY, Zhao H, Li WX. Integrated Analysis of Transcriptome and Prognosis Data Identifies FGF22 as a Prognostic Marker of Lung Adenocarcinoma. Technol Cancer Res Treat. 2019; 18:1533033819827317. https://doi.org/10.1177/1533033819827317 [PubMed]
- 68. Zuberi K, Franz M, Rodriguez H, Montojo J, Lopes CT, Bader GD, Morris Q. GeneMANIA prediction server 2013 update. Nucleic Acids Res. 2013; 41:W115–22. https://doi.org/10.1093/nar/gkt533 [PubMed]