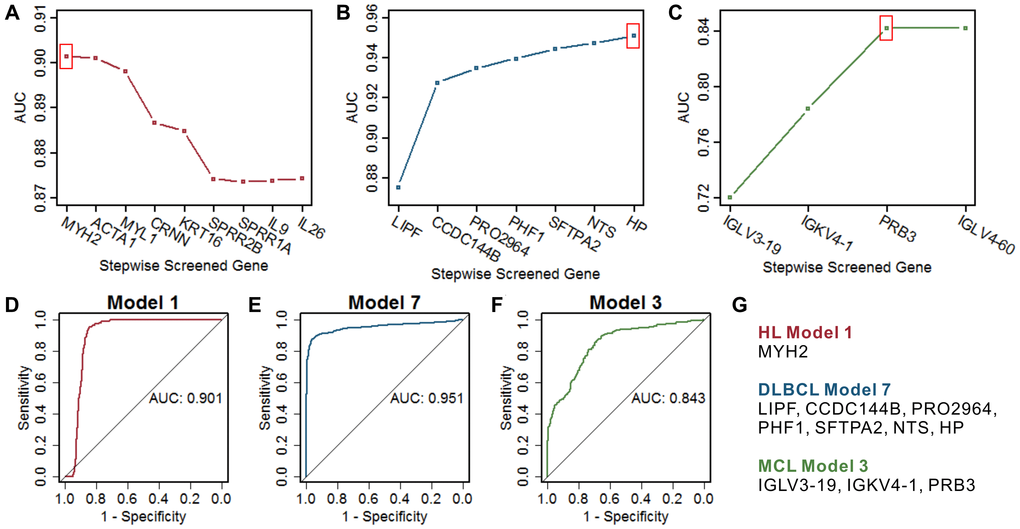
Figure 4.Screening of the optimal multigene prediction model for three lymphomas. (A–C) Stepwise screened multigene prediction models in HL, DLBCL, and MCL. From left to right on the x-axis (stepwise screened genes), each additional gene corresponds to a model [for example, in (A), MYH2 represents model 1, which contains one gene of MYH2, ACTA1 represents model 2, which contains two genes including MYH2 and ACTA1]. The red box shows the optimal model for each type of lymphoma. (D–F) ROC curves of the screened optimal models for each type of lymphoma. (G) Genes in the screened optimal models for three lymphomas. HL, Hodgkin's lymphoma; DLBCL, diffuse large B-cell lymphoma; MCL, mantle cell lymphoma.