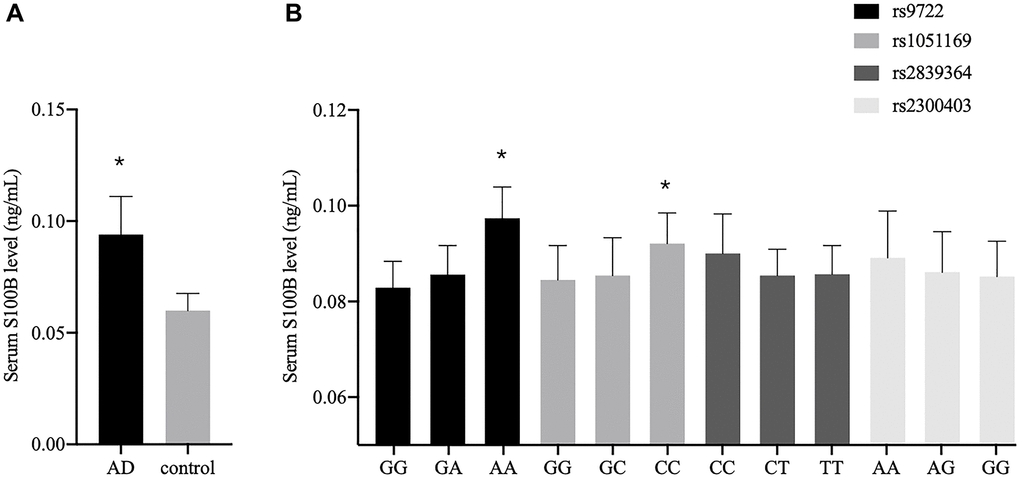
Figure 2.Serum S100B levels among different groups. (A) Serum S100B levels between the AD patients and the controls. (B) Serum S100B levels among different genotypes in the AD patients (*P < 0.05).
Figure 2 — S100B gene polymorphisms are associated with the S100B level and Alzheimer’s disease risk by altering the miRNA binding capacity | Aging