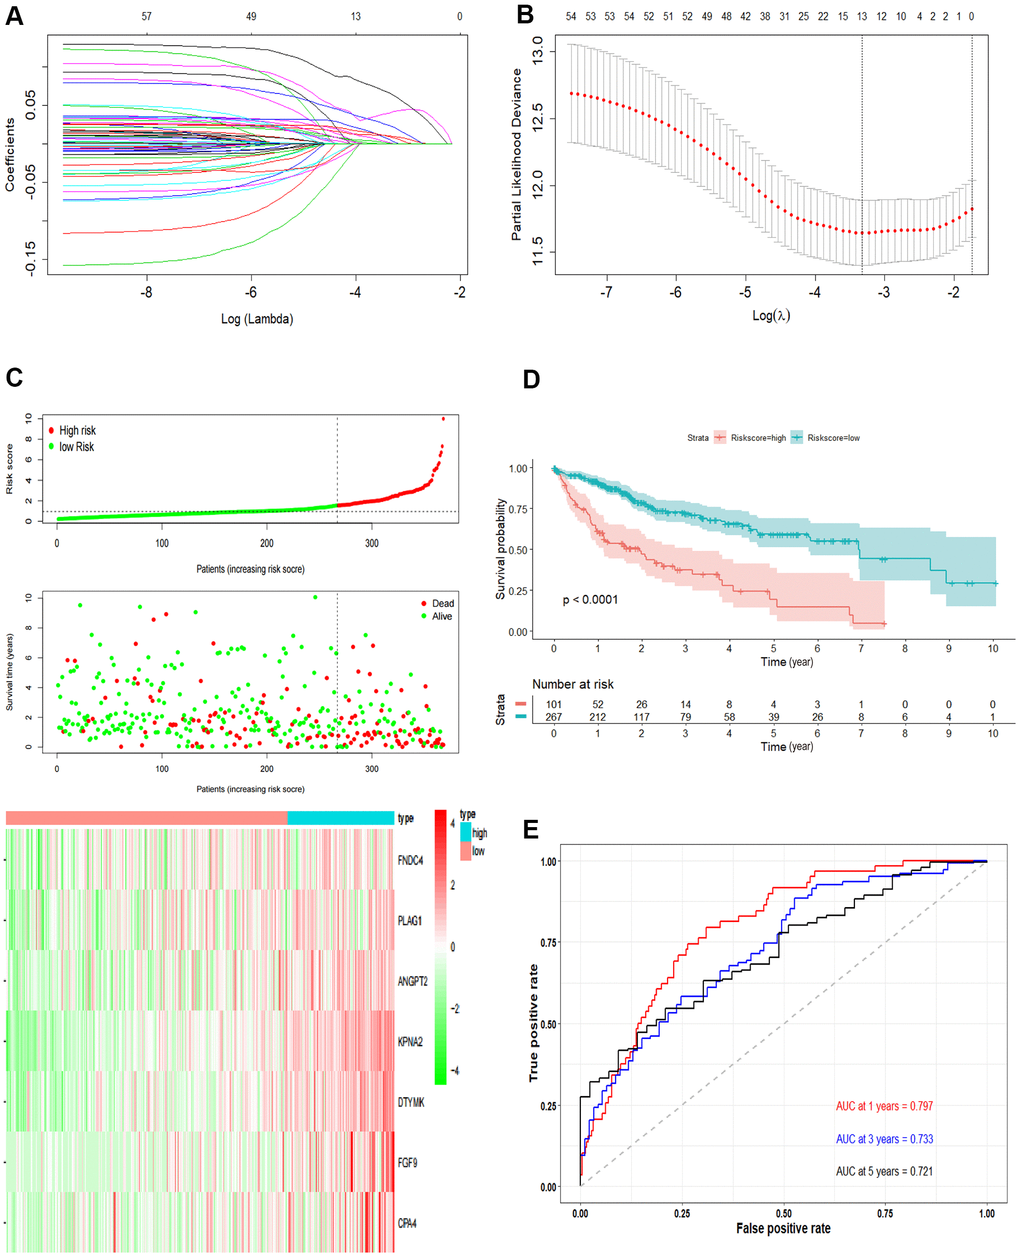
Figure 3.Development the prognostic model. (A, B) Lasso regression analysis results. The trajectory of each independent variable, the horizontal axis represents the log value of the independent variable lambda, and the vertical axis represents the coefficient of the independent variable. The tuning parameter (λ) was calculated based on the partial likelihood deviance with ten-fold cross validation. The dotted vertical lines are drawn at the optimal values by minimum criteria and 1-SE criteria. (C) The risk scores distribution, survival status, and gene expression patterns of patients in high and low-risk groups. The dot presents patient status ranked by the increasing risk score. The X axis is patient number and Y axis is survival time. (D) Kaplan–Meier survival curve of two groups. (E) The time-dependent ROC curves analyses of two groups.