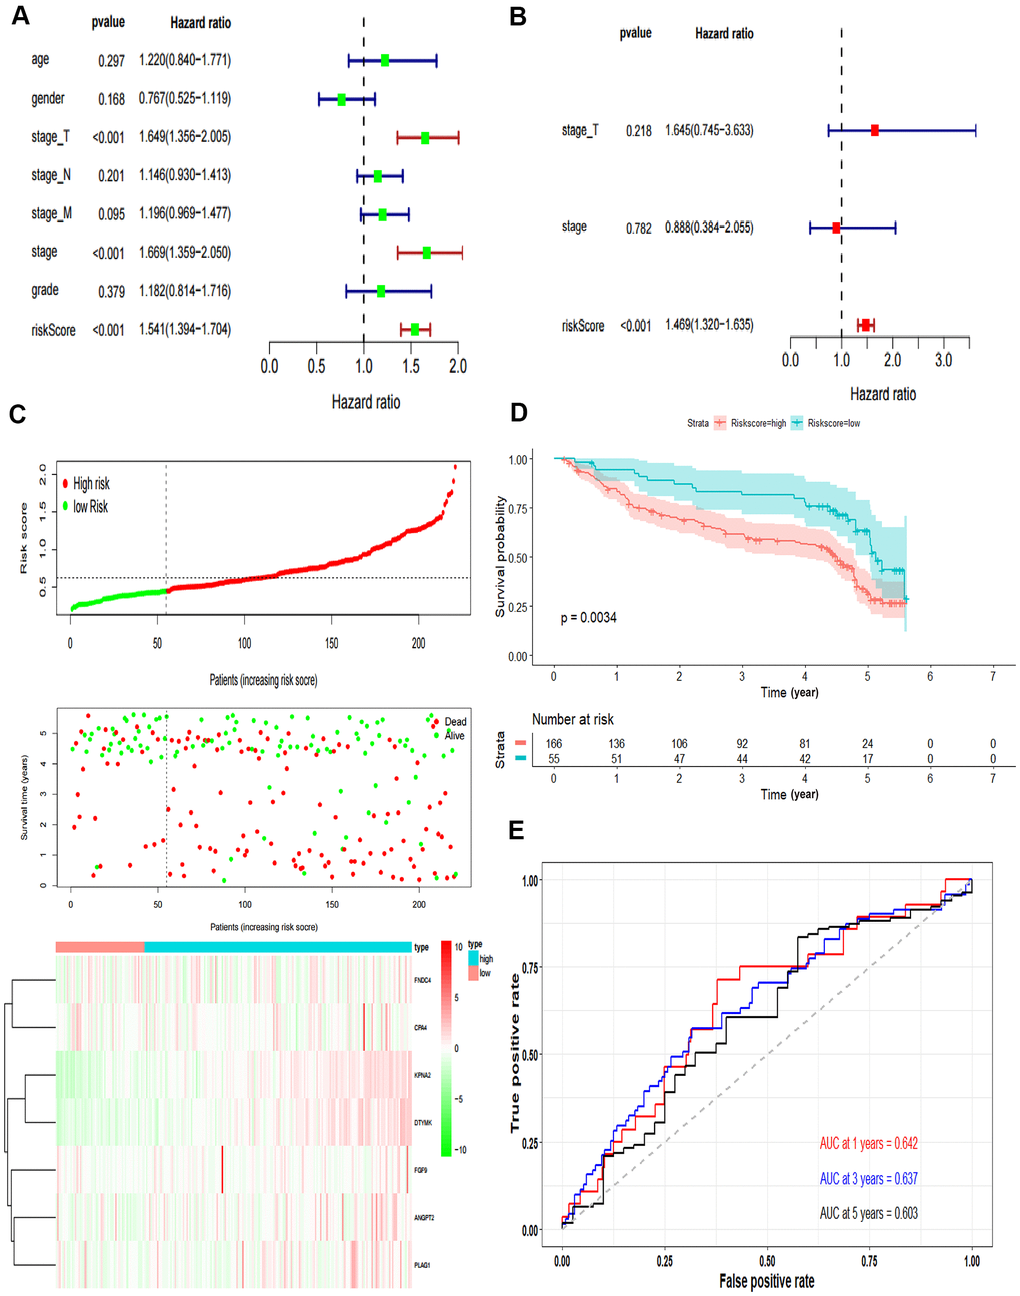
Figure 4.Validation of the prognostic model. (A) Forrest plot of the univariate Cox regression analysis in TCGA. (B) Forrest plot of the multivariate Cox regression analysis in TCGA. (C) The risk scores distribution, survival status, and gene expression patterns of HCC patients in GSE14520. The dot presents patient status ranked by the increasing risk score. The X axis is patient number and Y axis is survival time. (D) Kaplan–Meier survival curve of two groups in GSE14520. (E) The time-dependent ROC curves analyses of two groups in GSE14520.