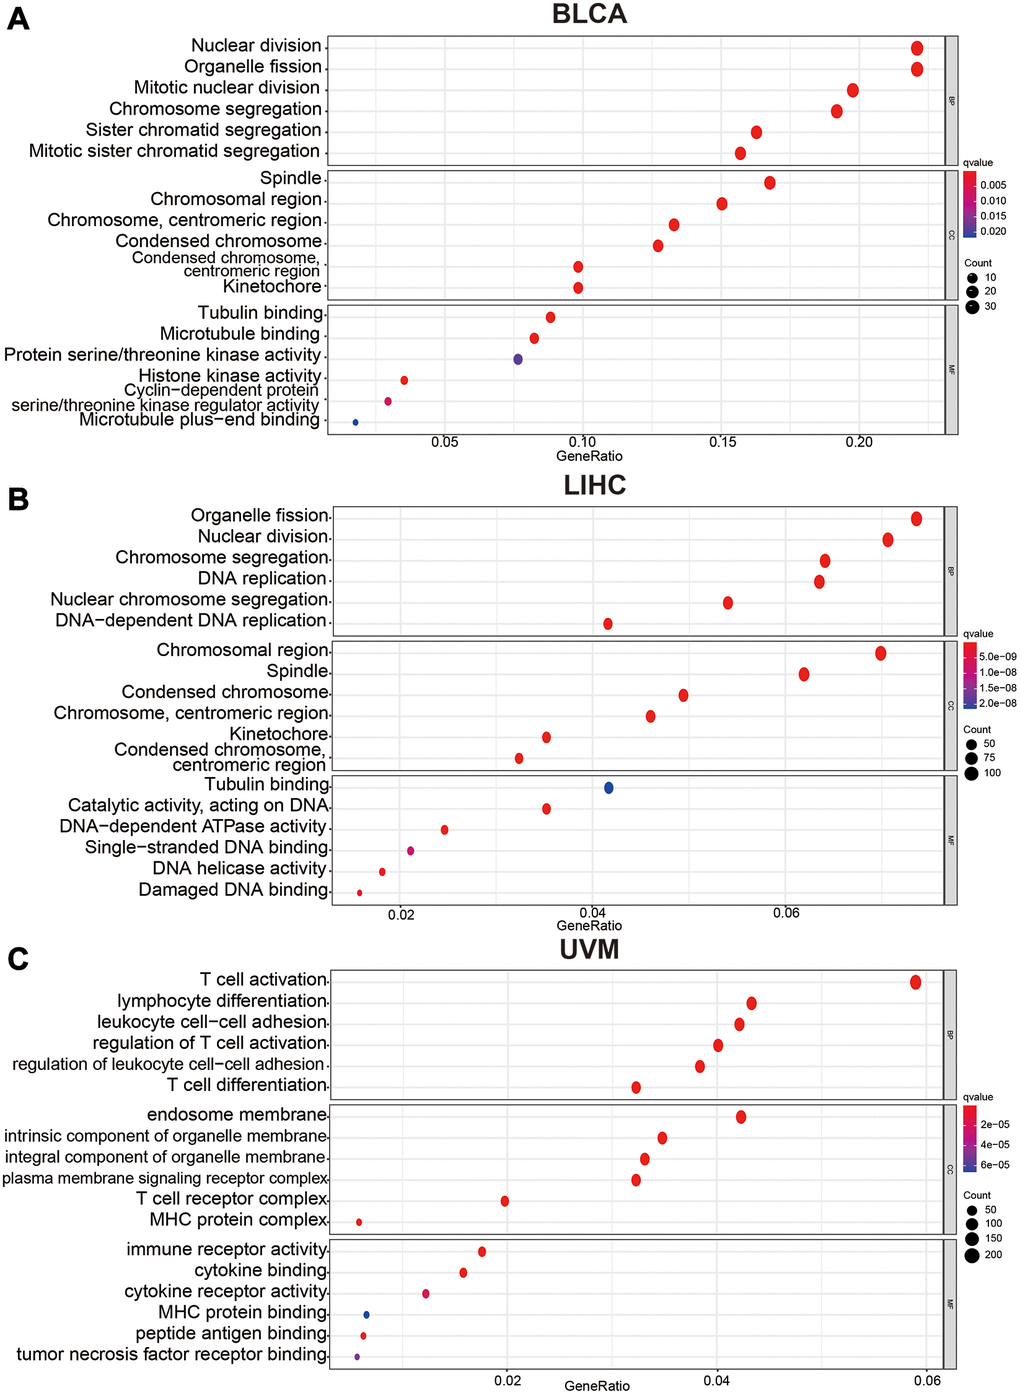
Figure 5.Bubble charts of Gene Ontology analysis including BP (biological process), CC (cellular component), and MF (molecular function) across C12orf75 interactive gene lists in (A) BLCA, (B) LIHC and, (C) UVM. Colored by p-values. Bubble size represents the number of enriched genes.