


Introduction
Tumors remain a leading cause of morbidity and mortality worldwide. Poor prognosis related with high recurrence and progression rates remains the main challenge of cancer therapy, which is often complicated by an insidious onset, invasiveness, rapid growth, and metastasis [1]. In 2019, more than 1.5 million people were diagnosed with different types of cancer worldwide, with 600,000 patients in the United States alone [2]. The number of patients diagnosed with cancer is increasing, leading to a significant economic burden and health policy challenge. In 2018, bladder cancer was the ninth most common cancer [3], and hepatocellular carcinoma (HCC) was the fourth leading cause of cancer deaths in the world [4]. Even with the rapid development of tumor diagnosis and treatment methods in recent years, cancer remains a major threat to human health. Therefore, it is necessary to clarify the mechanisms of cancer occurrence and identify cancer-related biomarkers for prognosis and treatment.
Chromosome 12 open reading frame 75 (C12orf75) gene, located on 12q23.3, was first designated Overexpressed in Colorectal Carcinoma-1 (OCC-1). In the earliest research, the C12orf75 gene was found to play a non-coding regulatory role, and it was confirmed to be expressed and up-regulated during the differentiation of mesenchymal stem cells into adipocytes [5, 6]. In recent years, C12orf75 was found to have a close relationship with human cancers. In different colorectal cancer studies, C12orf75 was found to either promote or inhibit cancer cell growth [7]. Similarly, C12orf75 was reported to promote the apoptosis of breast cancer cells [8]. However, there was no research clarifying the association between C12orf75 and other human cancer types in the previous literature. Based on the available studies, C12orf75 appears to play dual roles, either promoting or inhibiting tumor progression depending on the cancer type, but there was a lack of broader studies in different human cancers.
To our best knowledge, this is the first study to comprehensively analyze C12orf75 expression and its correlation with the prognosis of different types of malignant tumors using databases such as The Cancer Genome Atlas (TCGA), Oncomine, GEPIA, and PrognoScan. To reveal the possible mechanism of the dual roles of C12orf75 in different cancers, the potential correlation between C12orf75 expression and immune infiltration status was investigated using the TIMER and GEPIA databases. We conducted GO analysis and found pathways through which C12orf75 possibly influences tumor biological phenotype in conjunction with the TCGA database. Finally, we verified the deduced potential function through experiments with cancer cell lines and analysis of patient samples.
Methods
Difference expression analysis of C12orf75
The Oncomine database, the largest oncogene chip database, and integrated data-mining tool, was used to reveal the differentiation of C12orf75 mRNA expression level between tumors and normal tissues in different types of carcinoma [9]. The Oncomine results were exhibited with the p-value of 0.001, the top 10% gene ranking, and fold change of 1.5. Meanwhile, Gene Expression Profiling Interactive Analysis 2 (GEPIA2) was used to demonstrate the expression differentiation of the C12orf75 in different types of carcinoma and tissues by matching TCGA and GTEx data (normal tissue) [10]. The parameter settings were differential methods of ANOVA and log-scale of log2(TPM + 1).
Data acquisition
We downloaded and processed TCGA mRNA expression data and phenotype data from the UCSC Xena browser(http://xena.ucsc.edu/) [11, 12]. For gene expression, the RNA-Seq (polyA+ Illumina HiSeq) data were downloaded as log2 (fragments per kilobase of transcript per million mapped reads upper quartile (FPKM)+ 1) values. All quantification files were selected, and all files in clinical sections were analyzed. From the differentially expressed gene found in TCGA, C12orf75 was chosen for this study.
Survival analysis
The R package "limma" was used to normalize the expression data of the C12orf75 gene of TCGA-FPKM [13]. The median was as the cut-off value to divide the patients into high and low expression groups and then used the R package "survival" to analyze survival differences including overall survival (OS), disease-specific survival (DSS), disease-free interval (DFI), and progression-free interval (PFI) in different cancers between high and low groups. And Kaplan-Meier survival curves drawn based on differences of C12orf75 expression were generated by the R package "survival" in different cancers. The p-values were calculated from the log-rank test and corrected using the Benjamini-Hochberg method. The p-values was considered as significant. PrognoScan (http://dna00.bio.kyutech.ac.jp/PrognoScan/index.html) was further applied in survival analysis around the association between prognostic and different expression levels of C12orf75 expression in distinct carcinoma [14]. In all available microarray datasets of PrognoScan, the C12orf75 expression level was searched to determine its prognosis relationship. R software package "forestplot” was used to imagine the survival analysis from PrognoScan [15]. And univariate and multivariate Cox survival analysis was also achieved by using the R package "survival" to verify the independence of C12orf75 as a biomarker.
Analysis of the clinicopathological features
HTSeq-fragments per kilobase of transcript per million mapped reads (FPKM) and the corresponding phenotype data were utilized to analyze the relationship between clinicopathological features and expression level of C12orf75. we used "ggplot" and "ggpubr" software packages in R to perform Plots and statistical analysis [16]. p-values were calculated using a non-paired Wilcox test.
Genetic alteration analysis
The cBioPortal web (https://www.cbioportal.org/) was used to queries the genetic alteration features of C12orf75 [17, 18]. The option of "Quick select" and "TCGA Pan-Cancer Atlas Studies" was selected. The alteration frequency, copy number alteration (CNA), and mutation type were depicted in the "Cancer Types Summary" module overall TCGA database.
Immune infiltration analysis
The correlation between C12orf75 expression and immune infiltration was discovered utilizing the TIMER (http://cistrome.org/TIMER/) and GEPIA databases [10, 19]. We analyzed the expression of C12orf75 under the abundance of B cells, CD4+ T cells, CD8+ T cells, neutrophils, macrophages, and dendritic cells (DC). And the association between C12orf75 expression difference and tumor purity was investigated. Besides the common investigation of immune cell types, investigating the relationship between C12orf75 expression differences and individual markers of immune cells was utilized to distinguish possible subtypes of immune infiltration cells. The R&D Systems website (https://www.rndsystems.com/cn/resources/cell-markers/immune-cells) was applied to define gene markers in different types of immune cells. Similarly, in GEPIA, the correlation analysis between the expression of immune cell markers and C12orf75 was carried out on the TCGA mRNA expression data set. The correlation coefficient was determined by the Spearman method and p-values were corrected using the Benjamini-Hochberg method.
Methylation analysis
DNMIVD offered prognostic models based on DNA methylation and gene expression data from TCGA [20]. The association between the methylation of gene promoters and survival status was also accessible online.
Enrichment analysis
The "clusterProfiler" R package was utilized to perform Gene Ontology (GO) enrichment analysis [21]. The data for biological process (BP), cellular component (CC), and molecular function (MF) were depicted as bubble charts. The R language software [R-3.6.0, 64-bit] (https://www.r-project.org/) was applied in this analysis. The enriched pathways were depicted with the "enrichplot" and "ggplot2" R packages at last.
RNA interference
RNA interference was used to knock down C12orf75. Liver cancer cells were plated into each well of a 6-well plate. After 24 hours, in each well, those cells were transfected with 3.75 μl lipofectamine 3000 and 5 μl of siRNA oligo (20 μM) for 48 hours. Cells were re-digested and subjected to indicated assays. (C12orf75 siRNA sequence: siRNA#1 GTGTCCAGTCAAACAAAGA; siRNA#2 CTACCATCTGAAGCTGTCA; siRNA#3 CTATGGAGGAGTATATGTT).
RT-PCR
The C12orf75 forward primer sequence was AGCCAAAGATGTAACAGAAGAATCCG, and the reverse primer sequence was ACAGCTTCAGATGGT AGGCCAAC. The Ct values of the indicated genes were normalized to those of the internal control GAPDH. Each experiment was repeated three times. The 2-ΔΔCt method was used to calculate relative expression.
Cell viability assays
Under the manufacturer instructions, cell viability was examined utilizing the Cell Counting Kit-8 (CCK-8) (Beyotime Institute of Biotechnology, China). The indicated numbers of cells (counted using a Cellometer Mini, Nexcelom Bioscience, Massachusetts, USA) were plated into 96-well plates and cultured for 5 days with replacement of the culture medium every two days. An aliquot comprising 100 μl of Cell Counting Kit-8 solution was dripped to each well and incubated for 1 hour, followed by measuring the absorbance value at 450 nm (Elx800; BioTek Instruments, Inc., Winooski, VT, USA). For the colony formation assay, the indicated numbers of cells were plated into 6-well plates. Fourteen days later, the cells were fixed with 4% formaldehyde, stained with 1% crystal violet (Sigma-Aldrich, USA), and photographed. The Alpha Innotech imaging system (Singapore Alphatron Asia Co., Ltd.) was used to count and analyze the colonies.
Transwell assay
The bottom membrane was coated with Matrigel from BD Biosciences for Transwell invasion assays. Transwell chamber without Matrigel was employed for Transwell migration assays. Serum-free cell resuspension was added to the apical chamber, and serum-containing medium was added to the basolateral chamber. After incubating for 24 hours, the cells were fixed with 4% paraformaldehyde for 15 minutes and stained with crystal violet for 15 minutes. The stained cells were counted using a light microscope.
Flow cytometric analysis
Previous stable LIHC (hepatocellular liver carcinoma) cell lines were plated in 6-well plates and then which were then treated with siRNA oligo. After two days, the cells were washed twice with cold phosphate-buffered saline (PBS, HyClone), fixed with 75% ethanol, and stored at 4°C. After 24 hours, the cells were washed and collected by cold PBS. P-phycoerythrin (PE) stain was dripped into each tube and incubated at 4°C for 30 min before the cell cycle analysis. Bar graphs were the mean ± SD of three separate experiments. *p < 0.05, **p < 0.01.
Results
C12orf75 expression levels in different types of human cancer
To assess the significance of C12orf75 expression in cancer, the difference of C12orf75 expression between tumor samples and matched normal tissues was analyzed using the Oncomine website. C12orf75 was highly expressed in cervical cancer, colorectal cancer, esophageal cancer, head and neck cancer, kidney cancer, leukemia, liver cancer, and ovarian cancer. However, the expression was relatively lower in leukemia, lymphoma, myeloma, and prostate cancer (Figure 1A). The status of C12orf75 expression in different cancers is summarized in Supplementary Table 1. The results suggested that C12orf75 is overexpressed in most human cancers. To further estimate the variation of C12orf75 expression among tumors and normal tissues in distinct cancer types, the GEPIA online server was utilized to investigate the RNA expression from TCGA and GTEx projects (Figure 1B). Compared to matched normal tissues, C12orf75 was overexpressed in adrenocortical carcinoma (ACC), urothelial bladder carcinoma (BLCA), colon adenocarcinoma (COAD), diffuse large B-cell lymphoma (DLBC), esophageal carcinoma (ESCA), glioblastoma multiforme (GBM), head and neck squamous cell carcinoma (HNSC), kidney chromophobe (KICH), kidney renal papillary cell carcinoma (KIRP), acute myeloid leukemia (LAML), brain lower grade glioma (LGG), hepatocellular liver carcinoma (LIHC), lung squamous cell carcinoma (LUSC), ovarian serous cystadenocarcinoma (OV), pancreatic adenocarcinoma (PAAD), rectum adenocarcinoma (READ), stomach adenocarcinoma (STAD), thymoma (THYM), and uterine corpus endometrial carcinoma (UCEC). Meanwhile, decreased expression of C12orf75 was in prostate adenocarcinoma (PRAD).
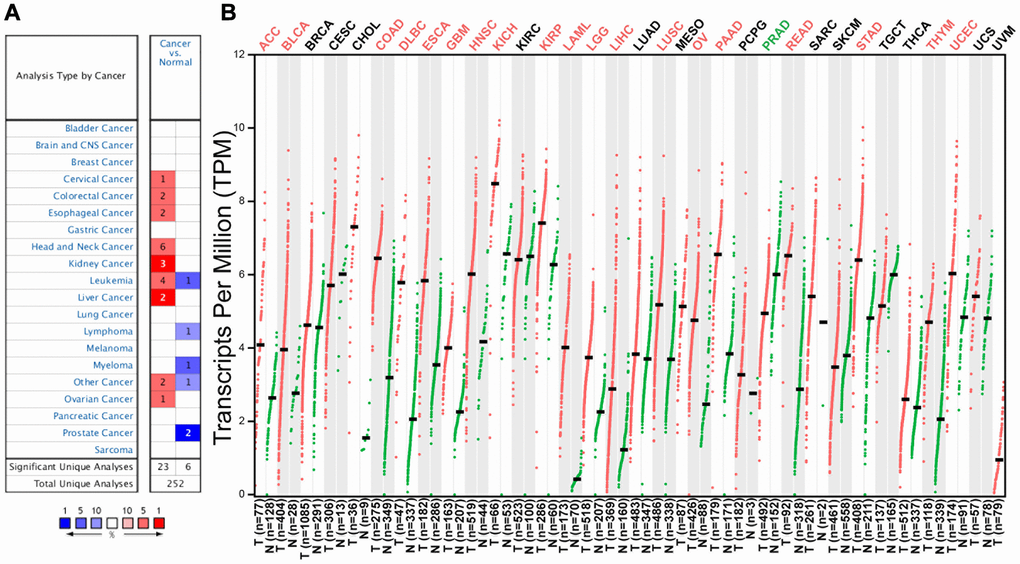
Figure 1. C12orf75 expression levels in different human cancers and survival curves comparing the high and low expression of C12orf75 in different types of cancers in the TCGA database. (A) Increased or decreased expression of C12orf75 in different cancer tissues compared with normal tissues in ONCOMINE. The number in each cell is the number of datasets. (B) C12orf75 expression profile across all tumor samples and paired normal tissues determined by GEPIA. The red and green letters describe an increase and a decrease in cancer, respectively. C12orf75, chromosome 12 open reading frame 75; GEPIA, Gene Expression Profiling Interactive Analysis.
Potential prognostic value of C12orf75 in various cancers
To investigate the correlation between C12orf75 expression and patient prognosis in human cancers, we applied the "survival" R package to investigate the relationship between the C12orf75 expression data of various cancers in TCGA and the patients' survival time. The results suggested that overexpression of C12orf75 was associated with a poor prognosis in bladder urothelial carcinoma (BLCA) (OS log-rank p = 0.0362, hazard ratio [HR] = 1.392 [1.037–1.868]; DSS log-rank p = 0.0208, hazard ratio [HR] = 1.581 [1.110–2.250]; PFI log-rank p = 0.0208, hazard ratio [HR] = 1.491 [1.110–2.004]) (Figure 2A–2C), hepatocellular liver carcinoma (LIHC) (OS log-rank p = 0.0026, hazard ratio [HR] = 1.829 [1.289–2.595]; DSS log-rank p = 0.0162, hazard ratio [HR] = 1.724 [1.151–2.584]; PFI log-rank p = 0.0484, hazard ratio [HR] = 1.336 [1.019–1.753]) (Figure 2D–2F), and UVM (uveal melanoma) (OS log-rank p < 0.0001, hazard ratio [HR] = 7.076 [2.601–19.247]; DSS log-rank p < 0.0001, hazard ratio [HR] = 8.050 [2.687–24.119]; PFI log-rank p < 0.0003, hazard ratio [HR] = 4.319 [1.879–9.924]) (Figure 2G–2I). By contrast, the overexpression of C12orf75 in kidney renal papillary cell carcinoma (KIRP) (OS log-rank p = 0.0473, hazard ratio [HR] = 0.524 [0.283–0.969]; DSS log-rank p = 0.0134, hazard ratio [HR] = 0.331 [0.149–0.735]; PFI log-rank p = 0.0473, hazard ratio [HR] = 0.563 [0.335–0.947]) (Figure 2J–2L) was associated with a better prognosis. These results indicated that high C12orf75 expression was correlated with shorter survival time in patients with BLCA, LIHC, and UVM, but a longer survival time in KIRP. Besides, univariate and multivariate Cox survival analysis was performed to further verify the feasibility of C12orf75 as an independent prognostic biomarker, and its expression level was still able to predict prognosis well in BLCA, KIRP, LIHC, and UVM datasets (Supplementary Tables 2–5). And, in other datasets, the hazard ratio was analyzed between the prognosis of patients with diverse cancers and the expression of C12orf75 by PrognoScan (Supplementary Figure 1).
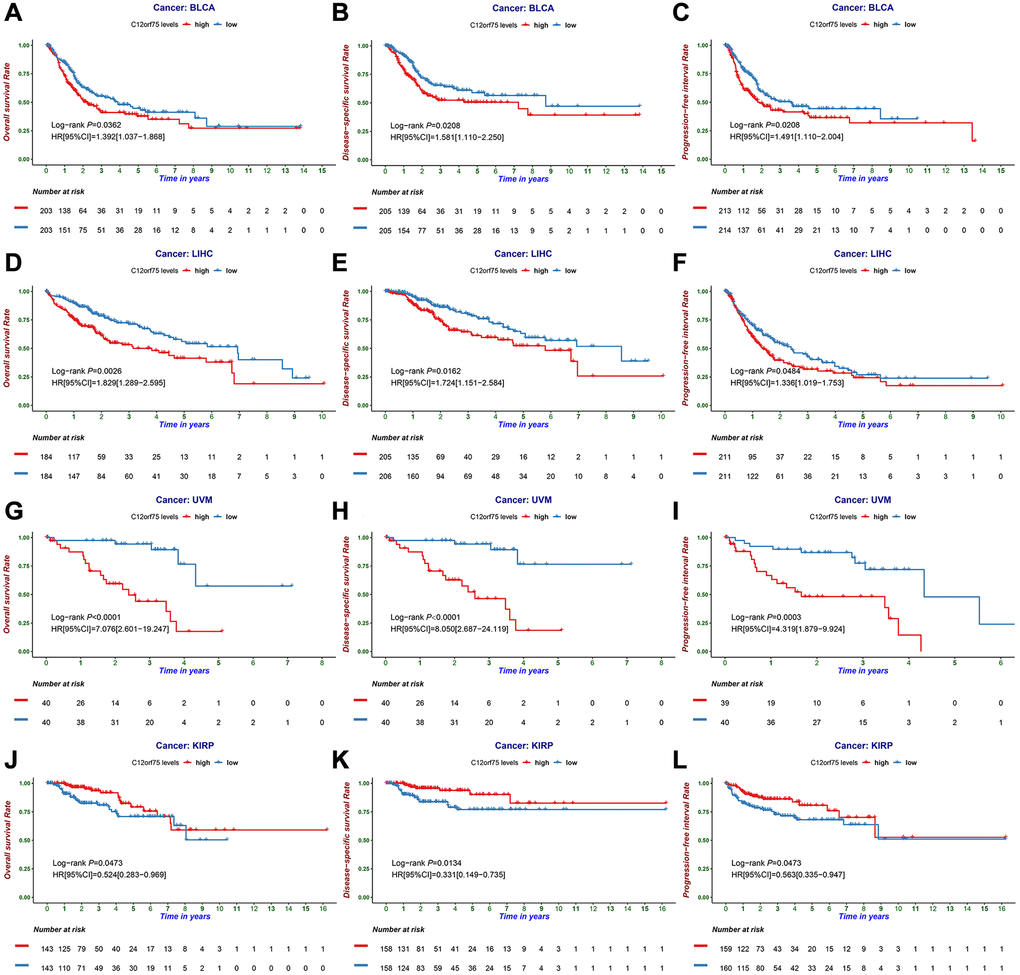
Figure 2. The prognostic information of the C12orf75 gene. (A) OS, (B) DSS, and (C) PFI survival curve of bladder urothelial carcinoma (BLCA); (D) OS, (E) DSS and (F) PFI survival curve of liver hepatocellular carcinoma (LIHC); (G) OS, (H) DSS and (I) PFI survival curve of uveal melanoma (UVM); (J) OS, (K) DSS and (L) PFI survival curve of kidney renal papillary cell carcinoma (KIRP); OS, overall survival; DSS, disease-specific survival; PFI, progression-free interval. P-values from the log-rank test. P-values were corrected using the Benjamini-Hochberg method. p < 0.05 is considered as significant.
Relationship between C12orf75 expression and clinicopathological features
To better understand the influence of C12orf75 expression on the prognosis in cancer types that showed a distinct correlation, we analyzed various clinicopathological features in selected cancers in the TCGA database using the “ggpubr” R package. The results suggested that in BLCA, Caucasian and Black American patients had significantly higher C12orf75 expression than Asian patients (p < 0.001). The expression level of C12orf75 was significantly higher in nonpapillary than papillary carcinoma (p < 0.001). Bladder cancer of tumor stage III-IV had higher C12orf75 expression than stage I-II (p = 0.0089). According to the pathological staging, the expression of C12orf75 in stage T3-4 neoplasms was dramatically higher than in stage T1-2 (p = 0.0035). The histological tumor grade was positively correlated with the expression of C12orf75 (p < 0.001), and increased expression of C12orf75 was positively associated with tumor progression after treatment (p = 0.0025). At the last follow-up, the expression of C12orf75 was higher in patients with cancer than patients without cancer (p < 0.001) (Figure 3A). We next analyzed the association between clinicopathological features and RNA expression of C12orf75 in the TCGA-LIHC datasets. Tumors in stages III-IV had noticeably higher levels of C12orf75 than stages I-II (p = 0.034). The pathological stage was strongly related with the expression of C12orf75, with higher expression in T3-4 than T1-2 (p = 0.023). The RNA expression of C12orf75 was positively correlated with the histological tumor grade in the TCGA liver cancer dataset (p = 0.0026) (Figure 3B). In KIRP, the expression of C12orf75 in the tumors from female patients was significantly higher than in those from male patients (p < 0.001). Type 1 KIRP had an unambiguous increase of the C12orf75 expression level in the KIRP datasets (p = 0.0021). However, the level of C12orf75 transcript in KIRP tumors at an advanced clinical stage was significantly decreased compared with the early clinical stage (p = 0.043). From a clinicopathological viewpoint, the expression of C12orf75 had a negative correlation with the tumor size and tumor invasion status (p = 0.043 and p = 0.034, respectively). At the last follow-up, the expression of C12orf75 was considerably higher in patients with cancer than patients without cancer (p = 0.0067) (Figure 3C).
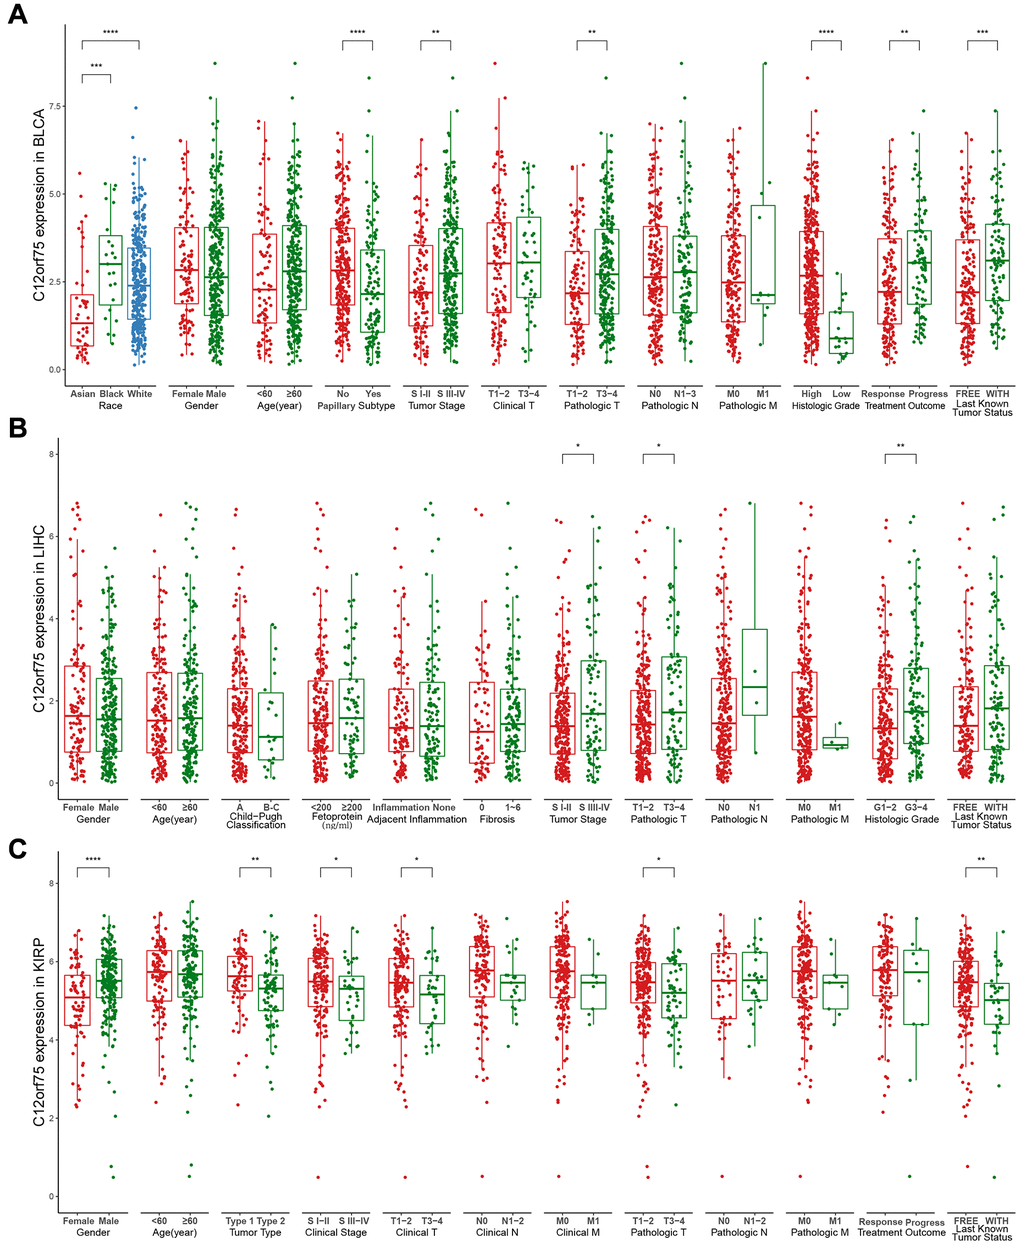
Figure 3. Box plot showing C12orf75 expression levels in BLCA (A), LIHC (B) and, KIRP (C) of TCGA-database based on different clinicopathological features including race, gender, age, Child-Pugh classification, tumor type, papillary subtype, fetoprotein, clinical stage, tumor stage, adjacent inflammation, fibrosis, histologic grade, clinical T, clinical N, clinical M, pathologic T, pathologic N, pathologic M, treatment outcome, last known tumor status.
Analysis of genetic alterations
The genetic alterations of C12orf75 in distinct tumors among the TCGA cohorts were further studied. The highest alteration frequency of C12orf75 (> 1.2%) was found for patients with prostate tumors and was associated with "amplification" (Figure 4A). The "amplification" type of copy number alteration (CNA) was the major type not only in prostate cancer, but also in ovarian cancer, breast cancer, bladder cancer, pheochromocytoma and paraganglioma (PCPG), esophageal cancer, stomach cancer, KIRP, and lung squamous carcinoma (Figure 4A). The types, sites, and case numbers of the C12orf75 genetic mutations were shown in Figure 4B. Truncating mutations of C12orf75 were the primary type of genetic alteration among them.
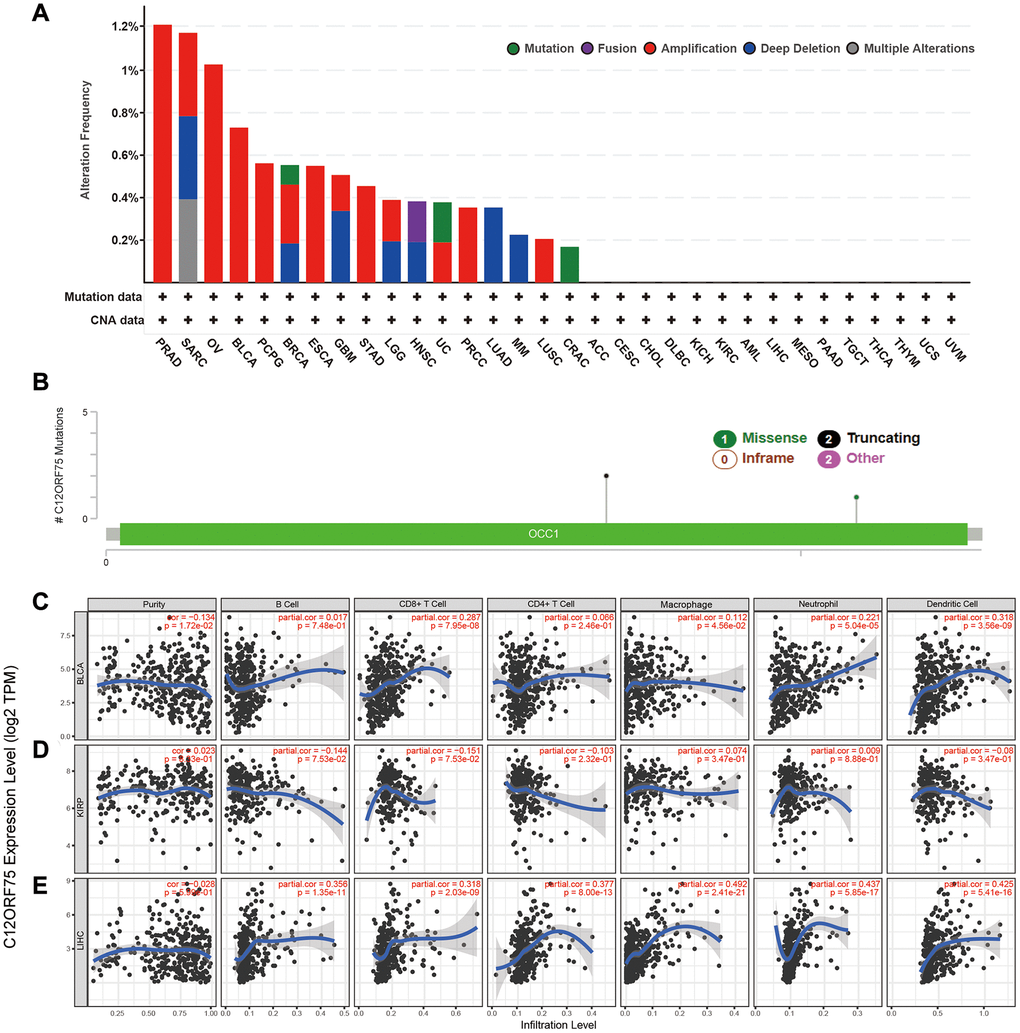
Figure 4. Mutation feature of C12orf75 in different tumors of TCGA and correlation of C12orf75 expression with immune infiltration level in BLCA, KIRP, and LIHC. The alteration frequency with mutation type (A) and mutation site (B) are displayed. (C) In BLCA, C12orf75 expression has a significant negative correlation with tumor purity, a significant positive correlation with infiltrating levels of CD8+ T cell, macrophage, neutrophil, and dendritic cell, and no relation with infiltrating levels of B cell and CD4+ T cell. (D) In KIRP, C12orf75 expression has no significant correlation with tumor purity, significant negative correlation with infiltrating levels of B cell and, CD8+ T cell, and no relation with infiltrating levels of CD4+ T cell, macrophage, neutrophil, and dendritic cell. (E) In LIHC, C12orf75 expression has no significant correlation with tumor purity and, significant positive correlation with infiltrating levels of B cell, CD8+ T cell, CD4+ T cell, macrophage, neutrophil, and dendritic cell. ACC, adrenocortical carcinoma; AML, acute myeloid leukemia; BLCA, bladder urothelial carcinoma; BRCA, breast invasive carcinoma; CESC, cervical squamous cell carcinoma and endocervical adenocarcinoma; CHOL, cholangiocarcinoma; CRAC, colorectal cancer; DLBC, lymphoid neoplasm diffuse large B-cell lymphoma; ESCA, esophageal carcinoma; GBM, glioblastoma multiforme; HNSC, head and neck squamous cell carcinoma; KICH, kidney chromophobe; KIRC, kidney renal clear cell carcinoma; KIRP, kidney renal papillary cell carcinoma; LGG, brain lower grade glioma; LIHC, liver hepatocellular carcinoma; LUAD, lung adenocarcinoma; LUSC, lung squamous cell carcinoma; MESO, mesothelioma; MM, malignant melanoma; OV, ovarian serous cystadenocarcinoma; PAAD, pancreatic adenocarcinoma; PCPG, pheochromocytoma and paraganglioma; PRAD, prostate adenocarcinoma; PRCC, papillary renal cell carcinoma; SARC, Sarcoma; STAD, Stomach adenocarcinoma; TGCT, testicular germ cell tumors; THCA, thyroid carcinoma; THYM, thymoma; UC, uterine cancer; UCS, uterine carcinosarcoma; UVM, uveal melanoma. P-values were corrected using the Benjamini-Hochberg method. p < 0.05 is considered as significant.
Correlations between C12orf75 expression and immune cell infiltrates
Considering the results of TCGA analysis, the status of immune infiltration in BLCA, KIRP, LIHC, MESO, UVM and UCS was further explored (Figure 4C–4E, Supplementary Figure 2). In BLCA, the C12orf75 RNA expression had considerably positive correlations with the infiltration levels of CD8+ T cells (R = 0.287, p = 7.95E-08), macrophages (R = 0.112, p = 4.56E-02), neutrophils (R = 0.221, p = 5.04E-05), and dendritic cells (DCs; R = 0.318, p = 3.56E-9) (Figure 4C). In KIRP, the C12orf75 expression level had no significant association with the infiltration levels of immune cells (Figure 4D). In LIHC, the C12orf75 RNA expression had considerable positive correlations with the infiltration levels of B cells (R = 0.356, p = 1.35E-11), CD8+ T cells (R = 0.318, p = 2.03E-09), CD4+ T cells (R = 0.377, p = 8.00E-13), macrophages (R = 0.492, p = 2.41E-21), neutrophils (R = 0.437, p = 5.85E-17), and DCs (R = 0.425, p = 5.41E-16) (Figure 4E).
Correlation between C12orf75 expression and immune markers
The possible relationship between C12orf75 and several immune cell markers was further explored in TIMER and GEPIA. Infiltration by distinct subtypes of T cells, such as Tfh, Th1, Th2, Th9, Th17, Th22, Treg, and exhausted T cells, was also calculated for BLCA, KIRP, LIHC, MESO, UVM, and UCS (Table 1, Supplementary Table 6). The RNA level of C12orf75 had a consistent positive correlation with 38 of the 45 immune cell markers in BLCA, 40 of the 45 immune cell markers in LIHC, and 18 of the 45 immune cell markers in KIRP after adjusting for tumor purity. Furthermore, we explored the difference in immune markers between cancers and adjacent tissues in GEPIA. The results indicated that C12orf75 had a consistent correlation with the infiltration levels of tumor-associated macrophages in BLCA and LIHC, while it was not significantly associated with macrophage infiltration in normal tissues. However, C12orf75 had no substantial association with the infiltration levels of tumor-associated macrophages in KIRP (Table 2).
Table 1. Analysis of correlations expression between C12orf75 and Gene Markers of Immune Cells in BLCA, LIHC, and KIRP by TIMER.
| Cell type | Gene marker | BLCA (n = 408) | LIHC (n = 371) | KIRP (n = 290) | |||||||||||||||||||||||||||||||||||||||||||||||||||||||||||||||||||||||||||||||||||||||||||||||
| Cor | p | Cor | p | Cor | p | ||||||||||||||||||||||||||||||||||||||||||||||||||||||||||||||||||||||||||||||||||||||||||||||
| B cell | CD19 | 0.055 | ** | 0.209 | *** | −0.193 | * | ||||||||||||||||||||||||||||||||||||||||||||||||||||||||||||||||||||||||||||||||||||||||||||
| MS4A1 | −0.033 | 0.384 | 0.031 | 0.332 | −0.038 | 0.870 | |||||||||||||||||||||||||||||||||||||||||||||||||||||||||||||||||||||||||||||||||||||||||||||
| CD38 | 0.281 | *** | 0.225 | *** | −0.169 | 0.091 | |||||||||||||||||||||||||||||||||||||||||||||||||||||||||||||||||||||||||||||||||||||||||||||
| CD8+ T Cell | CD8A | 0.243 | *** | 0.240 | *** | −0.148 | 0.214 | ||||||||||||||||||||||||||||||||||||||||||||||||||||||||||||||||||||||||||||||||||||||||||||
| CD8B | 0.238 | *** | 0.226 | *** | −0.223 | * | |||||||||||||||||||||||||||||||||||||||||||||||||||||||||||||||||||||||||||||||||||||||||||||
| Tfh | CXCR5 | 0.020 | * | 0.199 | *** | −0.190 | 0.080 | ||||||||||||||||||||||||||||||||||||||||||||||||||||||||||||||||||||||||||||||||||||||||||||
| ICOS | 0.247 | *** | 0.263 | *** | −0.083 | 0.612 | |||||||||||||||||||||||||||||||||||||||||||||||||||||||||||||||||||||||||||||||||||||||||||||
| BCL6 | −0.191 | *** | 0.151 | ** | 0.165 | * | |||||||||||||||||||||||||||||||||||||||||||||||||||||||||||||||||||||||||||||||||||||||||||||
| Th1 | IL12RB2 | 0.419 | *** | 0.240 | *** | 0.337 | *** | ||||||||||||||||||||||||||||||||||||||||||||||||||||||||||||||||||||||||||||||||||||||||||||
| IL27RA | 0.277 | *** | 0.492 | *** | 0.085 | 0.176 | |||||||||||||||||||||||||||||||||||||||||||||||||||||||||||||||||||||||||||||||||||||||||||||
| TBX21 | 0.162 | *** | 0.127 | ** | −0.089 | 0.635 | |||||||||||||||||||||||||||||||||||||||||||||||||||||||||||||||||||||||||||||||||||||||||||||
| Th2 | CCR3 | −0.052 | 0.826 | 0.418 | *** | −0.019 | 0.716 | ||||||||||||||||||||||||||||||||||||||||||||||||||||||||||||||||||||||||||||||||||||||||||||
| STAT6 | −0.159 | *** | 0.238 | *** | 0.489 | *** | |||||||||||||||||||||||||||||||||||||||||||||||||||||||||||||||||||||||||||||||||||||||||||||
| GATA3 | −0.217 | *** | 0.319 | *** | −0.139 | * | |||||||||||||||||||||||||||||||||||||||||||||||||||||||||||||||||||||||||||||||||||||||||||||
| Th9 | TGFBR2 | 0.089 | * | 0.117 | * | 0.234 | *** | ||||||||||||||||||||||||||||||||||||||||||||||||||||||||||||||||||||||||||||||||||||||||||||
| IRF4 | 0.074 | *** | 0.219 | *** | −0.152 | 0.111 | |||||||||||||||||||||||||||||||||||||||||||||||||||||||||||||||||||||||||||||||||||||||||||||
| TNF | 0.256 | *** | 0.355 | *** | 0.136 | * | |||||||||||||||||||||||||||||||||||||||||||||||||||||||||||||||||||||||||||||||||||||||||||||
| Th17 | IL21R | 0.225 | *** | 0.387 | *** | −0.264 | *** | ||||||||||||||||||||||||||||||||||||||||||||||||||||||||||||||||||||||||||||||||||||||||||||
| IL23R | −0.033 | 0.999 | 0.158 | ** | 0.131 | 0.111 | |||||||||||||||||||||||||||||||||||||||||||||||||||||||||||||||||||||||||||||||||||||||||||||
| STAT3 | 0.195 | *** | 0.272 | *** | 0.195 | ** | |||||||||||||||||||||||||||||||||||||||||||||||||||||||||||||||||||||||||||||||||||||||||||||
| Th22 | CCR10 | −0.045 | 0.540 | 0.405 | *** | −0.055 | 0.302 | ||||||||||||||||||||||||||||||||||||||||||||||||||||||||||||||||||||||||||||||||||||||||||||
| AHR | −0.142 | *** | 0.127 | * | 0.309 | *** | |||||||||||||||||||||||||||||||||||||||||||||||||||||||||||||||||||||||||||||||||||||||||||||
| Treg | FOXP3 | 0.223 | *** | 0.193 | *** | −0.129 | 0.108 | ||||||||||||||||||||||||||||||||||||||||||||||||||||||||||||||||||||||||||||||||||||||||||||
| CCR8 | 0.204 | *** | 0.392 | *** | −0.207 | * | |||||||||||||||||||||||||||||||||||||||||||||||||||||||||||||||||||||||||||||||||||||||||||||
| IL2RA | 0.272 | *** | 0.362 | *** | −0.095 | 0.436 | |||||||||||||||||||||||||||||||||||||||||||||||||||||||||||||||||||||||||||||||||||||||||||||
| T cell exhaustion | PDCD1 | 0.171 | *** | 0.261 | *** | −0.156 | 0.091 | ||||||||||||||||||||||||||||||||||||||||||||||||||||||||||||||||||||||||||||||||||||||||||||
| CTLA4 | 0.192 | *** | 0.319 | *** | −0.090 | 0.608 | |||||||||||||||||||||||||||||||||||||||||||||||||||||||||||||||||||||||||||||||||||||||||||||
| Macrophage | CD68 | 0.129 | *** | 0.340 | *** | 0.101 | 0.082 | ||||||||||||||||||||||||||||||||||||||||||||||||||||||||||||||||||||||||||||||||||||||||||||
| ITGAM | 0.194 | *** | 0.586 | *** | −0.058 | 0.865 | |||||||||||||||||||||||||||||||||||||||||||||||||||||||||||||||||||||||||||||||||||||||||||||
| M1 | NOS2 | 0.147 | ** | 0.021 | 0.460 | −0.011 | 0.814 | ||||||||||||||||||||||||||||||||||||||||||||||||||||||||||||||||||||||||||||||||||||||||||||
| ROS1 | 0.229 | *** | 0.138 | 0.051 | −0.040 | 0.716 | |||||||||||||||||||||||||||||||||||||||||||||||||||||||||||||||||||||||||||||||||||||||||||||
| M2 | ARG1 | 0.030 | 0.826 | −0.237 | *** | 0.193 | * | ||||||||||||||||||||||||||||||||||||||||||||||||||||||||||||||||||||||||||||||||||||||||||||
| MRC1 | 0.223 | *** | 0.032 | 0.566 | −0.097 | 0.364 | |||||||||||||||||||||||||||||||||||||||||||||||||||||||||||||||||||||||||||||||||||||||||||||
| TAM | HLA-G | 0.135 | ** | 0.198 | *** | 0.221 | ** | ||||||||||||||||||||||||||||||||||||||||||||||||||||||||||||||||||||||||||||||||||||||||||||
| CD80 | 0.365 | *** | 0.397 | *** | −0.139 | 0.108 | |||||||||||||||||||||||||||||||||||||||||||||||||||||||||||||||||||||||||||||||||||||||||||||
| CD86 | 0.243 | *** | 0.475 | *** | −0.081 | 0.608 | |||||||||||||||||||||||||||||||||||||||||||||||||||||||||||||||||||||||||||||||||||||||||||||
| Monocyte | CD14 | 0.239 | *** | −0.279 | *** | −0.187 | * | ||||||||||||||||||||||||||||||||||||||||||||||||||||||||||||||||||||||||||||||||||||||||||||
| FCGR3A | 0.307 | *** | 0.414 | *** | −0.132 | 0.149 | |||||||||||||||||||||||||||||||||||||||||||||||||||||||||||||||||||||||||||||||||||||||||||||
| NK | XCL1 | 0.154 | ** | 0.264 | *** | −0.215 | * | ||||||||||||||||||||||||||||||||||||||||||||||||||||||||||||||||||||||||||||||||||||||||||||
| KIR3DL1 | 0.068 | ** | 0.026 | 0.332 | −0.056 | 0.746 | |||||||||||||||||||||||||||||||||||||||||||||||||||||||||||||||||||||||||||||||||||||||||||||
| CD7 | 0.164 | *** | 0.240 | *** | −0.234 | * | |||||||||||||||||||||||||||||||||||||||||||||||||||||||||||||||||||||||||||||||||||||||||||||
| Neutrophil | FUT4 | 0.304 | *** | 0.496 | *** | 0.202 | *** | ||||||||||||||||||||||||||||||||||||||||||||||||||||||||||||||||||||||||||||||||||||||||||||
| MPO | 0.268 | *** | 0.090 | * | −0.049 | 0.716 | |||||||||||||||||||||||||||||||||||||||||||||||||||||||||||||||||||||||||||||||||||||||||||||
| DC | CD1C | −0.090 | 0.831 | 0.168 | ** | 0.019 | 0.467 | ||||||||||||||||||||||||||||||||||||||||||||||||||||||||||||||||||||||||||||||||||||||||||||
| THBD | −0.088 | 0.822 | 0.170 | ** | 0.087 | 0.364 | |||||||||||||||||||||||||||||||||||||||||||||||||||||||||||||||||||||||||||||||||||||||||||||
| Cor value of Spearman’s correlation. p values were corrected using the Benjamini-Hochberg method. *p < 0.05; **p < 0.01; ***p < 0.001. | |||||||||||||||||||||||||||||||||||||||||||||||||||||||||||||||||||||||||||||||||||||||||||||||||||
Table 2. Analysis of correlations expression between C12orf75 and Gene Markers of B cells, macrophages, and monocytes in BLCA, LIHC, and KIRP by GEPIA.
| Cell type | Gene marker | BLCA | LIHC | KIRP | |||||||||||||||||||||||||||||||||||||||||||||||||||||||||||||||||||||||||||||||||||||||||||||||
| Tumor | Normal | Tumor | Normal | Tumor | Normal | ||||||||||||||||||||||||||||||||||||||||||||||||||||||||||||||||||||||||||||||||||||||||||||||
| R | p | R | p | R | p | R | p | R | p | R | p | ||||||||||||||||||||||||||||||||||||||||||||||||||||||||||||||||||||||||||||||||||||||||
| B cell | CD19 | 0.160 | * | 0.520 | 0.072 | 0.210 | *** | 0.480 | * | −0.140 | 0.090 | 0.290 | 0.264 | ||||||||||||||||||||||||||||||||||||||||||||||||||||||||||||||||||||||||||||||||||||||
| MS4A1 | 0.057 | 0.250 | 0.610 | 0.035 | 0.061 | 0.240 | 0.500 | * | 0.036 | 0.733 | 0.190 | 0.405 | |||||||||||||||||||||||||||||||||||||||||||||||||||||||||||||||||||||||||||||||||||||||
| CD38 | 0.360 | *** | 0.710 | * | 0.240 | *** | 0.430 | * | −0.057 | 0.582 | 0.250 | 0.320 | |||||||||||||||||||||||||||||||||||||||||||||||||||||||||||||||||||||||||||||||||||||||
| M1 | NOS2 | 0.170 | ** | 0.049 | 0.840 | 0.069 | 0.207 | 0.270 | 0.076 | −0.058 | 0.456 | −0.160 | 0.520 | ||||||||||||||||||||||||||||||||||||||||||||||||||||||||||||||||||||||||||||||||||||||
| ROS1 | 0.310 | *** | 0.170 | 0.653 | 0.130 | 0.013 | 0.190 | 0.216 | 0.018 | 0.829 | 0.540 | 0.015 | |||||||||||||||||||||||||||||||||||||||||||||||||||||||||||||||||||||||||||||||||||||||
| M2 | ARG1 | −0.110 | 0.029 | 0.170 | 0.653 | −0.230 | *** | 0.160 | 0.294 | 0.091 | 0.390 | 0.075 | 0.816 | ||||||||||||||||||||||||||||||||||||||||||||||||||||||||||||||||||||||||||||||||||||||
| MRC1 | 0.300 | *** | −0.190 | 0.653 | 0.071 | 0.204 | 0.280 | 0.076 | 0.067 | 0.520 | −0.055 | 0.829 | |||||||||||||||||||||||||||||||||||||||||||||||||||||||||||||||||||||||||||||||||||||||
| TAM | HLA-G | 0.160 | * | 0.370 | 0.240 | 0.250 | *** | 0.340 | 0.029 | 0.190 | 0.015 | 0.330 | 0.210 | ||||||||||||||||||||||||||||||||||||||||||||||||||||||||||||||||||||||||||||||||||||||
| CD80 | 0.410 | *** | 0.550 | 0.056 | 0.380 | *** | 0.540 | ** | −0.024 | 0.816 | 0.220 | 0.377 | |||||||||||||||||||||||||||||||||||||||||||||||||||||||||||||||||||||||||||||||||||||||
| CD86 | 0.330 | *** | 0.430 | 0.163 | 0.440 | *** | 0.550 | ** | 0.041 | 0.733 | 0.330 | 0.210 | |||||||||||||||||||||||||||||||||||||||||||||||||||||||||||||||||||||||||||||||||||||||
| Monocyte | CD14 | 0.320 | *** | 0.053 | 0.840 | −0.260 | *** | 0.016 | 0.910 | −0.098 | 0.390 | 0.040 | 0.830 | ||||||||||||||||||||||||||||||||||||||||||||||||||||||||||||||||||||||||||||||||||||||
| FCGR3A | 0.370 | *** | −0.095 | 0.840 | 0.410 | *** | 0.360 | 0.018 | 0.012 | 0.840 | 0.320 | 0.210 | |||||||||||||||||||||||||||||||||||||||||||||||||||||||||||||||||||||||||||||||||||||||
| R value of Spearman’s correlation. p values were corrected using the Benjamini-Hochberg method. *p < 0.01; **p < 0.001; ***p < 0.0001. | |||||||||||||||||||||||||||||||||||||||||||||||||||||||||||||||||||||||||||||||||||||||||||||||||||
Analysis of the association between promoter methylation and C12orf75 expression
Based on previous research, the association between expression of C12orf75 and promoter methylation in different cancer types was explored using DNMIVD (Supplementary Table 7) [22, 23]. Pearson's and Spearman's correlation coefficients and the corresponding p-values were calculated.
GO pathway enrichment analysis
To understand the influence of variety C12orf75 expression on the biological phenotype of tumor cells, we conducted GO pathway enrichment analysis of genes. Genes associated with C12orf75 were predicted to be involved in several biological processes, cellular components, and molecular functions. In BLCA, we found that nuclear division, organelle fission, mitotic nuclear division, chromosome segregation, sister chromatid segregation, and mitotic sister chromatid segregation were enriched in the category of biological processes, spindle, chromosomal region, centromeric region (chromosome), condensed chromosome, centromeric region (condensed chromosome) and kinetochore enriched into the category of cellular components, while tubulin binding, microtubule binding, protein serine/threonine kinase activity, histone kinase activity, cyclin-dependent protein (serine/threonine kinase activity) and microtubule plus-end binding were enriched into the category of molecular functions (Figure 5A). In LIHC, we found that organelle fission, nuclear division, chromosome segregation, DNA replication, nuclear chromosome segregation, and DNA-dependent DNA replication were enriched into the category of biological processes, chromosomal region, spindle, condensed chromosome, centromeric region (chromosome), kinetochore, centromeric region (condensed chromosome) and tubulin binding were enriched in the category of cellular components, while tubulin binding, catalytic activity (acting on DNA), DNA-dependent ATPase activity, single-stranded DNA binding, DNA helicase activity and damaged DNA binding were enriched in the category of molecular functions (Figure 5B). In UVM, we found that T cell activation, lymphocyte differentiation, leukocyte cell-cell adhesion, regulation of T cell activation, regulation of leukocyte cell−cell adhesion, and regulation of leukocyte cell−cell adhesion were enriched in the category of biological processes, endosome membrane, intrinsic component of organelle membrane, integral component of organelle membrane, plasma membrane signaling receptor complex, T cell receptor complex and, MHC protein complex were enriched in the category of cellular components, while immune receptor activity, cytokine binding, cytokine receptor activity, MHC protein binding, peptide antigen binding, and tumor necrosis factor receptor binding were enriched in the category of molecular functions (Figure 5C). These enriched pathways were positively associated with the biological characteristics of each tumor.
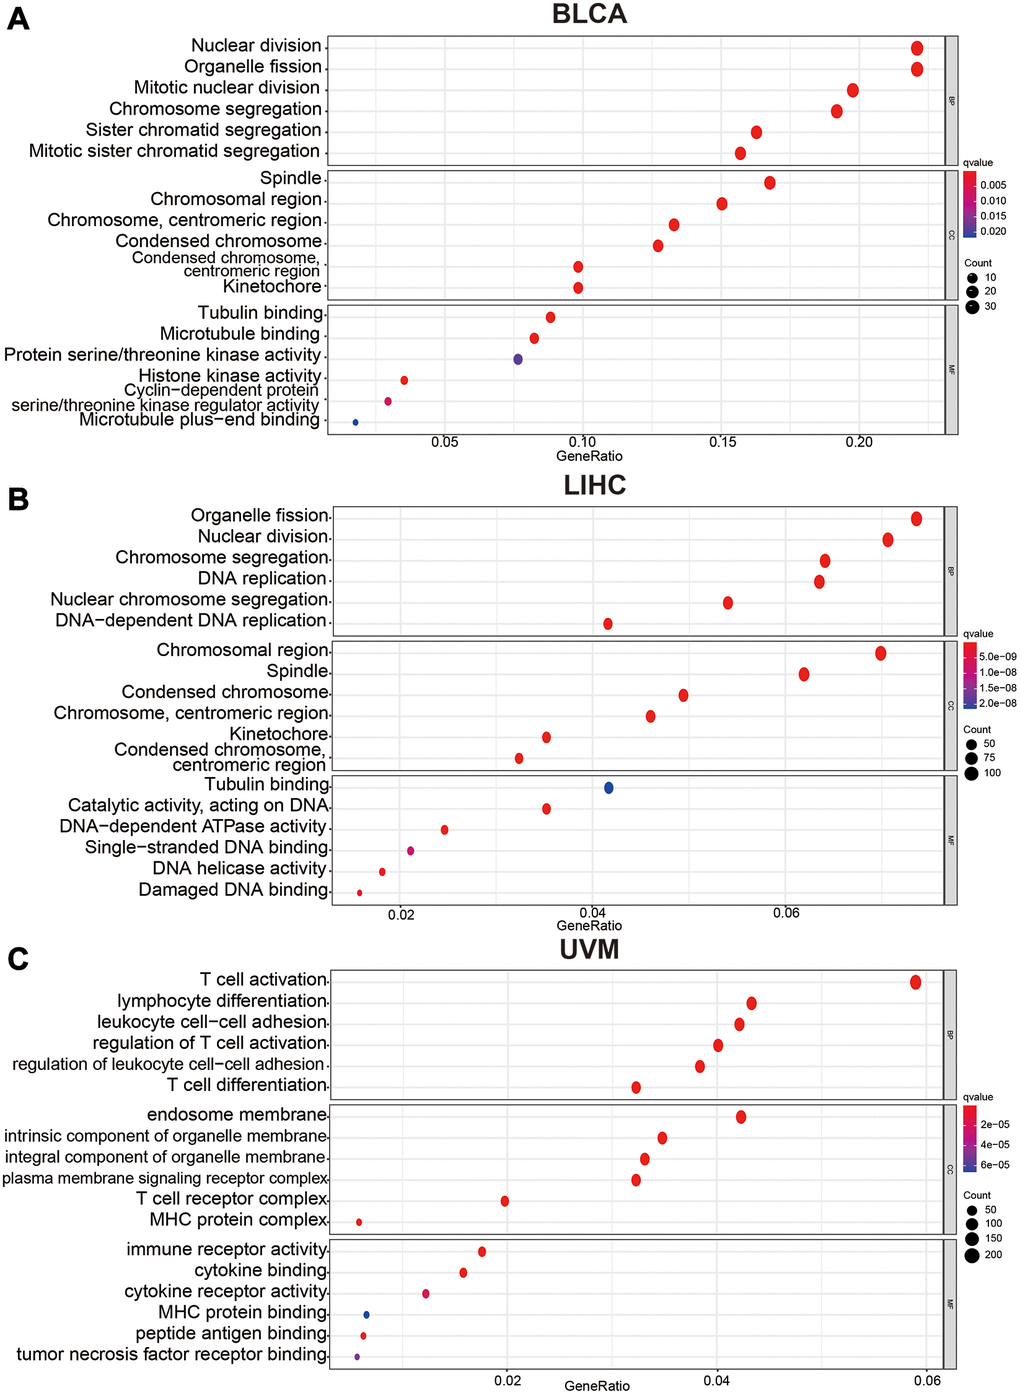
Figure 5. Bubble charts of Gene Ontology analysis including BP (biological process), CC (cellular component), and MF (molecular function) across C12orf75 interactive gene lists in (A) BLCA, (B) LIHC and, (C) UVM. Colored by p-values. Bubble size represents the number of enriched genes.
Upregulation of C12orf75 in HCC cell lines and tumor tissues
To explore the RNA expression C12orf75 in liver cancer, RT-PCR analysis was conducted in human normal hepatocyte cell line Hl-7702 and distinct liver cancer cell lines (Alex, Huh7, HepG2, 97H, Bel-7402, Hep3B, and, LM3). As shown in Figure 6A, the expression of C12orf75 was distinctly higher in the HCC cell lines than normal liver cell lines. Compared to Hl-7702 cells as the control, the fold change values of C12orf75 RNA expression in HCC cells were 1.629 (Alex, p < 0.01), 1.746 (Huh7, p < 0.001), 1.978 (HepG2, p < 0.01), 2.208 (97H, p < 0.001), 3.016 (Bel-7402, p < 0.001), 10.206 (Hep3B, p < 0.001), and 10.364 (LM3, p < 0.001). To verify the correlation between the C12orf75 and HCC tumorigenesis, the level of C12orf75 expression was quantified in paired HCC lesions and corresponding adjacent normal tissues using qRT-PCR analysis. As shown in Figure 6B, the RNA expression of C12orf75 was higher in HCC than paired adjacent normal tissues in all cases (average fold change 1.356, p = 0.0014). Thus, C12orf75 might play a cancer-promoting role in the tumorigenesis and progression of HCC.
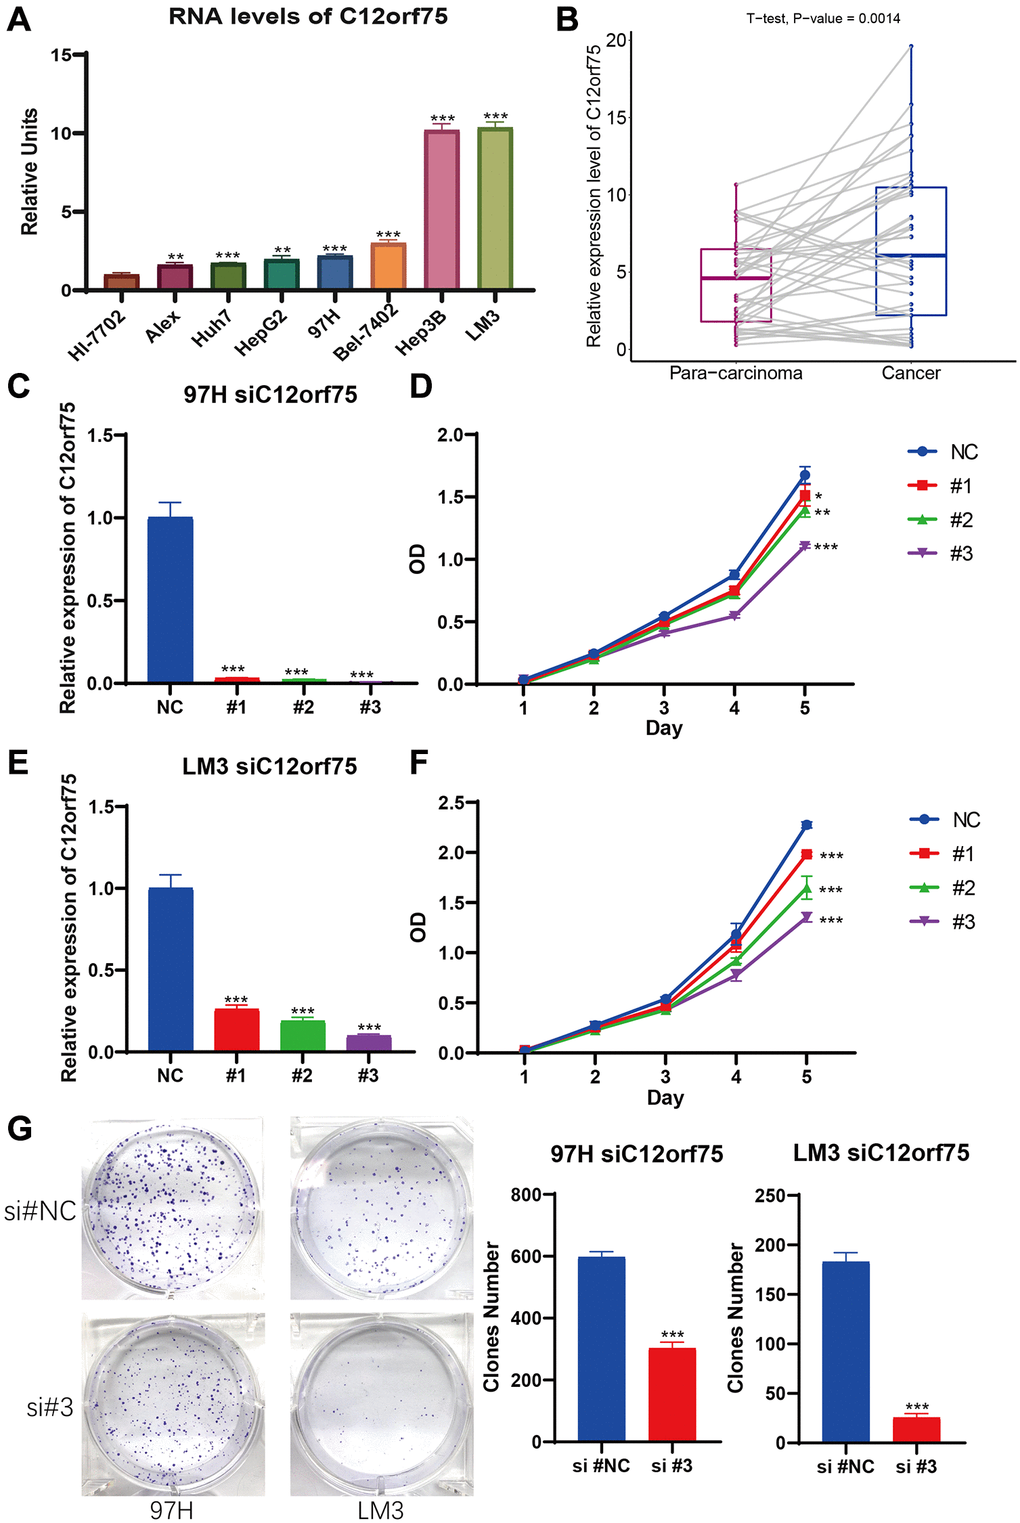
Figure 6. C12orf75 was the high expression in liver cancer cell lines and patient samples and knockdown C12orf75 suppresses LIHC proliferation. (A) Analysis of C12orf75 expression in HCC and normal liver cell lines. Compared to normal liver cell line HL-7702, C12orf75 was remarkably upregulated in several HCC cell lines: Alex, Huh7, HepG2, 97H, Bel-7402, Hep3B, and, LM3. Fold change = log2 ∆∆Ct, log2 ∆∆Ct = (CtGAPDH − Ct C12orf75) of test cell lines − (CtGAPDH − CtC12orf75) of Hl-7702. (B) Relative expression of C12orf75 in clinical HCC and adjacent liver tissues. C12orf75 expression was significantly higher in HCC tissues than that in adjacent liver tissues (p = 0.002, number of patients = 20). (C) RT-PCR was used to detect the efficiency of knockdown for C12orf75 in 97H. (D) 97H were treated with siRNA against C12orf75 for 24 hours and then subjected to the CCK-8 assay. (E) RT-PCR was used to detect the efficiency of knockdown for C12orf75 in LM3. (F) LM3 were treated with siRNA against C12orf75 for 24 hours and then subjected to the CCK-8 assay. (G) 97H and LM3 were treated with siRNA against C12orf75 for 24 hours and then subjected to the colony formation assay. *p < 0.05; **p < 0.01; ***p < 0.001.
Effect of C12orf75 downregulation on the proliferation, migration, and invasion of HCC cells
To mechanistically confirm the findings of expression analysis, we designed three siRNAs targeting the CDS or 3'-UTR of C12orf75 to silence its expression. Downregulation of the RNA expression of C12orf75 suppressed the proliferation ability of the liver cancer cells 97H and LM3 according to the CCK8 staining results (Figure 6C–6F). The third siRNA inhibited the expression of C12orf75 to the greatest extent, and also blocked the proliferation of HCC cells most obviously. The third, strongest siRNA targeting C12orf75 was also able to inhibit the proliferation of HCC cell lines 97H and LM3 according to the colony formation assay (Figure 6G). C12orf75 silencing also clearly reduced the migration and invasion ability of 97H and LM3 liver cancer cells (Figure 7A, 7B).
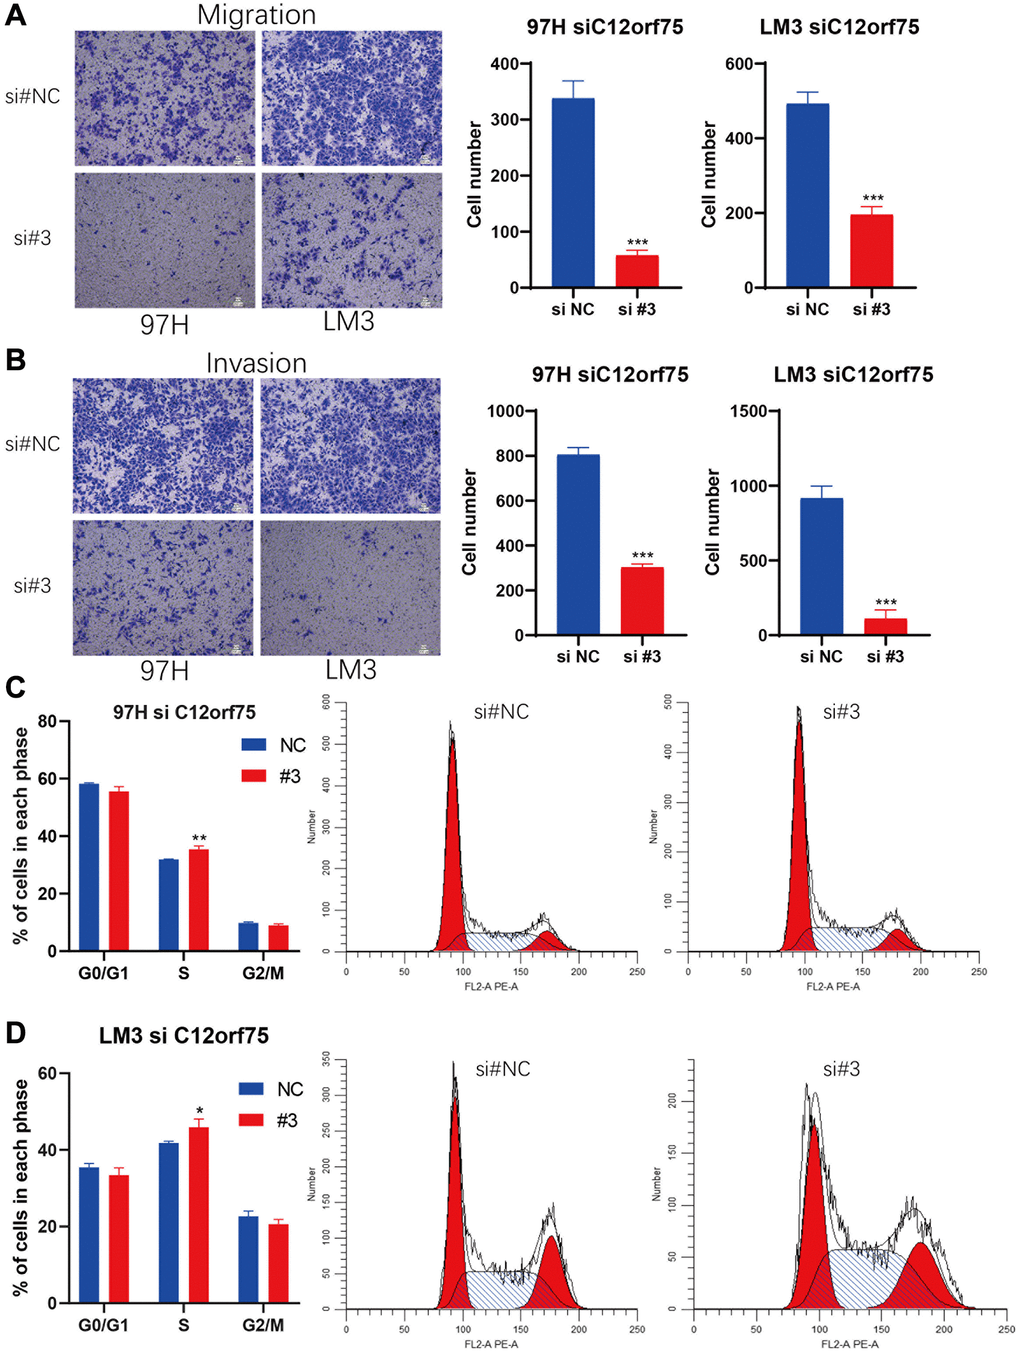
Figure 7. Knockdown of C12orf75 suppresses LIHC cell migration and invasion and arrests cell cycle.C12orf75 silencing suppresses cell migration (A) and invasion (B) of the 97H and LM3 (Scale bar: 200 μm.) and statistical comparisons of the indicated groups were performed. The data presented as mean ± SD from three independent experiments. Flow cytometry indicates that the knockdown of C12orf75 suppresses S to G2 transition in 97H (C) and LM3 (D) cells. *p < 0.05; **p < 0.01; ***p < 0.001.
Knockdown of C12orf75 leads to cell cycle arrest in HCC cells
Based on the results of RNA interference, we further explored the potential impact of C12orf75 on the cell cycle. We performed flow cytometry on 97H and LM3 cells with C12orf75 knockdown to examine cell cycle changes. The results showed that the S phase population was significantly increased after C12orf75 knockdown in 97H and LM3 cells (p < 0.01 and p < 0.05, respectively). Thus, C12orf75 knockdown induced cell cycle arrest in the S phase (Figure 7C, 7D).
Discussion
The chromosome 12 open reading frame 75 (C12orf75) gene was reported to be expressed and upregulated during the differentiation of mesenchymal stem cells into adipocytes. In related research in human cancers, C12orf75 was only reported in colorectal cancer and breast cancer [24, 25]. C12orf75 was found to inhibit CACO-2 proliferation [6], and it promoted tumor cell survival in the SW480 (Wnt+) derived from colorectal cancer. However, C12orf75 seemed to have the opposite effect in SW480 cells (Wnt–), instead increasing apoptosis of colorectal carcinoma cells [7]. Similarly, C12orf75 induced apoptosis in the breast cancer cell line (MCF7) [8]. These results suggest that the RNA expression of C12orf75 is correlated with various outcomes in different cancer types and led us to explore the correlations between C12orf75 expression and the prognosis of various human cancers.
We failed to find any other cancer-related study of C12orf75 through a comprehensive literature search. Therefore, we conducted a comprehensive investigation of the C12orf75 gene in distinct cancers based on TCGA and the GEO database. We found that the RNA expression of C12orf75 was increased in most types of tumors and is obviously associated with the prognosis of patients with BLCA, KIRP, LIHC, and UVM. Overall, the upregulation of C12orf75 expression promoted tumor progression in BLCA, LIHC, and UVM, while it seemed to be related with a better prognosis in KIRP patients (Figure 2A–2L). Thus, C12orf75 might serve as a prognostic and diagnostic biomarker for BLCA, LIHC, MESO, UCS, and UVM.
Next, the "ggpubr" R package was used to study the association between different clinicopathological features and C12orf75 expression levels according to TCGA database. Papillary and nonpapillary histological patterns of BLCA tumorigenesis were considered dual-track oncogenic pathways. The papillary type shows finger-like protrusions on the mucosal surface, and the nonpapillary tumors appear as flat lesions [26]. Even though these two patterns shared analogous chromosomal alterations, the downstream target genes vary considerably [27]. The papillary type is sometimes called papillary urothelial neoplasm because of its very low histological grade and non-invasiveness. Papillary histological types tend to have a better prognosis compared with the non-papillary type [28]. A higher level of C12orf75 could increase the risk of worse clinicopathological stage, histological grade, and treatment outcome, which had a significant positive correlation with nonpapillary histological patterns. Similarly, a higher level of C12orf75 expression could increase the risk of worse clinicopathological stage and histological grade in patients with HCC. These results indicated poor outcomes for BLCA and LIHC patients with relatively higher expression of C12orf75, and the relationship between C12orf75 and papillary/nonpapillary track oncogenic pathways needs to be confirmed in further studies. In patients with KIRP, a higher level of C12orf75 expression could decrease the risk of adverse clinicopathological stage and treatment outcome, which meant better outcomes for KIRP patients with relatively higher expression of C12orf75. These results strongly suggest that C12orf75 could serve as a prognostic biomarker in multiple cancers.
To further explore the genomic alternations of C12orf75 in various cancers, the genomic change data from TCGA was analyzed using cBioPortal. The results suggested that changes in the C12orf75 gene mainly occur in prostate sarcoma and ovarian cancer, but there were only 43 cases representing less than 0.1% of patients. Thus, there was a low incidence of C12orf75 mutations in the cancer genome [17, 18]. Further, unknown reasons for the change of C12orf75 expression in different cancers needed further study. Additionally, we were unable to retrieve any published research that clarifies the function of C12orf75 in tumor immunity. Understanding the tumor microenvironment may help decipher the mechanism of tumor development. As shown in Figure 4, the results of this study suggested that there is a significant correlation between tumor C12orf75 expression and immune cell infiltration. While the expression of C12orf75 did not show a correlation with tumor purity in KIRP and LIHC, there was a significant negative correlation with tumor purity in BLCA. Genes that are highly expressed by cells in the tumor microenvironment are considered to be negatively correlated with tumor purity. On the other hand, genes that are highly expressed in cancer cells are expected to be positively correlated with tumor purity. Our findings demonstrate that C12orf75 expression is positively correlated with the infiltration levels of CD8+ T cells, macrophages, neutrophils, and dendritic cells (DCs) in BLCA. Similarly, C12orf75 expression had a positive correlation with the infiltration levels of B cells, CD4+ T cells, CD8+ T cells, macrophages, neutrophils, and DCs in LIHC. Whereas C12orf75 expression had no significant correlation with the infiltration levels of immune cells in KIRP. Thus, C12orf75 may be involved in the process of promoting immune cell infiltration in BLCA and LIHC.
In line with expectations, the expression coefficients of some immune cell markers (such as ARG1, CD14, BCL6, CCR3, and CDR10) and C12orf75 were opposite to the expression coefficients of immune cells as a whole and C12orf75, which indicates that some specific immune cell subtypes may interact with C12orf75. In BLCA, there was a clear positive correlation between macrophage infiltration and C12orf75 expression, and the infiltration of CD8+ T cells, which is positively correlated with C12orf75 expression, was dominated by Th1 (T helper 1 cells) and Treg (T regulatory cells). In LIHC, both macrophages and B cells were significantly positively correlated with the expression of C12orf75. The infiltration of macrophages positively correlated with C12orf75 expression was dominated by TAM (Tumor-associated macrophage), in BLCA and LIHC. The recruitment of antigen-presenting cells in the tumor microenvironment is different among various cancers. Our results suggest that C12orf75 plays an important role in immune cell infiltration and recruitment of antigen presenting cells in the tumor microenvironment, which may directly affect the prognosis and survival of patients. In the early stage of tumorigenesis, macrophages and T cells are activated to attack tumor cells and inhibit cancer progression. However, once the tumor progresses, the immune system will in turn support the tumor cells and promote cancer progression, while also inhibiting the cytotoxicity mediated by immune cells [29]. Tumor cells can induce M2-like polarization of tumor-associated macrophage (TAM) by producing lactic acid [30]. The resulting M2 macrophages can in turn promote cancer progression by releasing inflammatory mediators (including IL-6, tumor necrosis factor, interferon-γ, proteases, ROS, and nitrogen compounds) [31, 32]. Additionally, TAM can promote the migration of tumor cells via paracrine feedback, enhancing the invasion ability of tumors via cathepsins and matrix remodelling enzymes secreted by the TAM [33–35]. In BLCA and LIHC, the expression of C12orf75 was positively correlated with a poor prognosis, which can be explained by the positive correlation between the expression of C12orf75 and the level of TAM infiltration. As shown in Table 2, the expression of C12orf75 in adjacent normal tissues had no significant association with immune cell infiltration, which also confirmed that C12orf75 did change the immune cell infiltration status in the tumor microenvironment relative to adjacent normal tissues.
Further Gene Ontology enrichment analysis of biological processes, cellular components, and molecular functions revealed that the pathways closely related with the oncogenic role of C12orf75 were enriched in BLCA and LIHC. Among them, differential genes were mainly enriched in pathways related to cell division and DNA replication.
Above all, the high expression of C12orf75 was confirmed in liver cancer cell lines and HCC patient samples. Moreover, inhibiting the expression of C12orf75 significantly arrested cell cycle and reduced the proliferation, migration, and invasion of HCC cells in vitro. According to the enrichment analysis, C12orf75 and its positively correlated genes were enriched in DNA replication and associated pathways. DNA replication begins in the early S phase [36]. Based on these results, we further performed flow cytometry experiments on liver cancer cells with downregulated C12orf75. The population of liver cancer cells in the S phase was increased significantly. Liver cancer cells were blocked in the S phase by knockdown of C12orf75 and it also shows that C12orf75 presumably involved in DNA replication or DNA damage check.
It should be noted that we only performed knockdown verification in vitro, but no overexpression. Moreover, only LIHC was verified. Thus, further research should verify the role of C12orf75 in other cancers, and the levels of immune infiltration should be verified by single-cell RNA sequencing to better reflect the actual infiltration of immune cells.
Conclusions
The differential expression of chromosome 12 open reading frame 75 (C12orf75) was correlated with tumorigenesis and cancer progression. The systemic analysis of C12orf75 in the present study was performed in various types of cancer, which clarified that C12orf75 upregulation was considerably associated with the worse survival and prognosis of patients with BLCA or LIHC. C12orf75 may influence the cancer prognosis by changing the tumor immune infiltration and the status of tumor DNA replication. However, a positive correlation between C12orf75 expression and the prognosis was found in KIRP patients. Finally, experiments elucidated the potential biological mechanisms of C12orf75 in HCC. C12orf75 has potential as a prognostic biomarker and therapeutic target for molecularly targeted drugs in urothelial bladder carcinoma, hepatocellular liver carcinoma, and renal papillary cell carcinoma.
Author Contributions
GC and GL designed this study. GC, TL, GJ, and JL extracted the information from the databases and analyzed the data. GC completed the verification experiments. CZ, XC, HL, and ZD supervised the entire study. GC wrote the manuscript. All authors revised the manuscript.
Acknowledgments
The authors would like to sincerely thank the TCGA for data sharing, as well as Oncomine, GEPIA, cBioPortal, PrognoScan, TIMER, and, DNMIVD for providing data processing and customizable functions. In particular, the author Xiaoping Chen would like to express deepest thanks to Prof.
Conflicts of Interest
The authors declare no conflicts of interest related to this study.
Funding
This work was supported by the State Key Project on Infectious Diseases of China (2018ZX10723204-003), the National Nature Science Foundation of China (Nos. 81874065, 81500565, 81874149, 81572427, and 81401997), the Hepato-Biliary-Pancreatic Malignant Tumor Investigation Fund of Chen Xiao-ping Foundation for the Development of Science and Technology of Hubei Province (CXPJJH11800001-2018356).
References
- 1. Siegel RL, Miller KD, Jemal A. Cancer statistics, 2019. CA Cancer J Clin. 2019; 69:7–34. https://doi.org/10.3322/caac.21551 [PubMed]
- 2. Solanki S, Chakinala RC, Haq KF, Khan MA, Kifayat A, Linder K, Khan Z, Mansuri U, Haq KS, Nabors C, Aronow WS. Inpatient burden of gastric cancer in the United States. Ann Transl Med. 2019; 7:772. https://doi.org/10.21037/atm.2019.11.54 [PubMed]
- 3. Siegel RL, Miller KD, Jemal A. Cancer statistics, 2018. CA Cancer J Clin. 2018; 68:7–30.
- 4. McGuire S. World Cancer Report 2014. Geneva, Switzerland: World Health Organization, International Agency for Research on Cancer, WHO Press, 2015. Adv Nutr. 2016; 7:418–19. https://doi.org/10.3945/an.116.012211 [PubMed]
- 5. Kikuchi K, Fukuda M, Ito T, Inoue M, Yokoi T, Chiku S, Mitsuyama T, Asai K, Hirose T, Aizawa Y. Transcripts of unknown function in multiple-signaling pathways involved in human stem cell differentiation. Nucleic Acids Res. 2009; 37:4987–5000. https://doi.org/10.1093/nar/gkp426 [PubMed]
- 6. Lan Y, Xiao X, He Z, Luo Y, Wu C, Li L, Song X. Long noncoding RNA OCC-1 suppresses cell growth through destabilizing HuR protein in colorectal cancer. Nucleic Acids Res. 2018; 46:5809–21. https://doi.org/10.1093/nar/gky214 [PubMed]
- 7. Najafi H, Soltani BM, Dokanehiifard S, Nasiri S, Mowla SJ. Alternative splicing of the OCC-1 gene generates three splice variants and a novel exonic microRNA, which regulate the Wnt signaling pathway. RNA. 2017; 23:70–85. https://doi.org/10.1261/rna.056317.116 [PubMed]
- 8. Ghalaei A, Kay M, Zarrinfam S, Hoseinpour P, Behmanesh M, Soltani BM. Overexpressed in colorectal carcinoma gene (OCC-1) upregulation and APPL2 gene downregulation in breast cancer specimens. Mol Biol Rep. 2018; 45:1889–95. https://doi.org/10.1007/s11033-018-4336-z [PubMed]
- 9. Rhodes DR, Kalyana-Sundaram S, Mahavisno V, Varambally R, Yu J, Briggs BB, Barrette TR, Anstet MJ, Kincead-Beal C, Kulkarni P, Varambally S, Ghosh D, Chinnaiyan AM. Oncomine 3.0: genes, pathways, and networks in a collection of 18,000 cancer gene expression profiles. Neoplasia. 2007; 9:166–80. https://doi.org/10.1593/neo.07112 [PubMed]
- 10. Tang Z, Li C, Kang B, Gao G, Li C, Zhang Z. GEPIA: a web server for cancer and normal gene expression profiling and interactive analyses. Nucleic Acids Res. 2017; 45:W98–102. https://doi.org/10.1093/nar/gkx247 [PubMed]
- 11. Tomczak K, Czerwińska P, Wiznerowicz M. The Cancer Genome Atlas (TCGA): an immeasurable source of knowledge. Contemp Oncol (Pozn). 2015; 19:A68–77. https://doi.org/10.5114/wo.2014.47136 [PubMed]
- 12. Haeussler M, Zweig AS, Tyner C, Speir ML, Rosenbloom KR, Raney BJ, Lee CM, Lee BT, Hinrichs AS, Gonzalez JN, Gibson D, Diekhans M, Clawson H, et al. The UCSC Genome Browser database: 2019 update. Nucleic Acids Res. 2019; 47:D853–58. https://doi.org/10.1093/nar/gky1095 [PubMed]
- 13. Ritchie ME, Phipson B, Wu D, Hu Y, Law CW, Shi W, Smyth GK. limma powers differential expression analyses for RNA-sequencing and microarray studies. Nucleic Acids Res. 2015; 43:e47. https://doi.org/10.1093/nar/gkv007 [PubMed]
- 14. Mizuno H, Kitada K, Nakai K, Sarai A. PrognoScan: a new database for meta-analysis of the prognostic value of genes. BMC Med Genomics. 2009; 2:18. https://doi.org/10.1186/1755-8794-2-18 [PubMed]
- 15. Mogensen UB, Ishwaran H, Gerds TA. Evaluating Random Forests for Survival Analysis using Prediction Error Curves. J Stat Softw. 2012; 50:1–23. https://doi.org/10.18637/jss.v050.i11 [PubMed]
- 16. Liu F, Qin L, Liao Z, Song J, Yuan C, Liu Y, Wang Y, Xu H, Zhang Q, Pei Y, Zhang H, Pan Y, Chen X, et al. Microenvironment characterization and multi-omics signatures related to prognosis and immunotherapy response of hepatocellular carcinoma. Exp Hematol Oncol. 2020; 9:10. https://doi.org/10.1186/s40164-020-00165-3 [PubMed]
- 17. Gao J, Aksoy BA, Dogrusoz U, Dresdner G, Gross B, Sumer SO, Sun Y, Jacobsen A, Sinha R, Larsson E, Cerami E, Sander C, Schultz N. Integrative analysis of complex cancer genomics and clinical profiles using the cBioPortal. Sci Signal. 2013; 6:pl1. https://doi.org/10.1126/scisignal.2004088 [PubMed]
- 18. Cerami E, Gao J, Dogrusoz U, Gross BE, Sumer SO, Aksoy BA, Jacobsen A, Byrne CJ, Heuer ML, Larsson E, Antipin Y, Reva B, Goldberg AP, et al. The cBio cancer genomics portal: an open platform for exploring multidimensional cancer genomics data. Cancer Discov. 2012; 2:401–04. https://doi.org/10.1158/2159-8290.CD-12-0095 [PubMed]
- 19. Li B, Severson E, Pignon JC, Zhao H, Li T, Novak J, Jiang P, Shen H, Aster JC, Rodig S, Signoretti S, Liu JS, Liu XS. Comprehensive analyses of tumor immunity: implications for cancer immunotherapy. Genome Biol. 2016; 17:174. https://doi.org/10.1186/s13059-016-1028-7 [PubMed]
- 20. Ding W, Chen J, Feng G, Chen G, Wu J, Guo Y, Ni X, Shi T. DNMIVD: DNA methylation interactive visualization database. Nucleic Acids Res. 2020; 48:D856–62. https://doi.org/10.1093/nar/gkz830 [PubMed]
- 21. Yu G, Wang LG, Han Y, He QY. clusterProfiler: an R package for comparing biological themes among gene clusters. OMICS. 2012; 16:284–87. https://doi.org/10.1089/omi.2011.0118 [PubMed]
- 22. Li G, Xu W, Zhang L, Liu T, Jin G, Song J, Wu J, Wang Y, Chen W, Zhang C, Chen X, Ding Z, Zhu P, Zhang B. Development and validation of a CIMP-associated prognostic model for hepatocellular carcinoma. EBioMedicine. 2019; 47:128–41. https://doi.org/10.1016/j.ebiom.2019.08.064 [PubMed]
- 23. Li GX, Ding ZY, Wang YW, Liu TT, Chen WX, Wu JJ, Xu WQ, Zhu P, Zhang BX. Integrative analysis of DNA methylation and gene expression identify a six epigenetic driver signature for predicting prognosis in hepatocellular carcinoma. J Cell Physiol. 2019; 234:11942–50. https://doi.org/10.1002/jcp.27882 [PubMed]
- 24. Isik A, Isik N, Kurnaz E. Complete breast autoamputation: Clinical image. Breast J. 2020; 26:2265–66. https://doi.org/10.1111/tbj.14072 [PubMed]
- 25. Isik NA, Kurnaz E, Isik A. Intermammary Pilonidal Disease. Galician Medical Journal. 2019; 26. https://doi.org/10.21802/gmj.2019.2.11
- 26. Tan TZ, Rouanne M, Huang RY, Thiery JP. Reply to Pontus Eriksson and Gottfrid Sjödahl's Letter to the Editor re: Tuan Zea Tan, Mathieu Rouanne, Kien Thiam Tan, Ruby Yun-Ju Huang, Jean-Paul Thiery. Molecular Subtypes of Urothelial Bladder Cancer: Results from a Meta-cohort Analysis of 2411 Tumors. Eur Urol. 2019; 75:423–32. Eur Urol. 2019; 75:e108–09. https://doi.org/10.1016/j.eururo.2018.11.048 [PubMed]
- 27. Guo CC, Czerniak B. Bladder Cancer in the Genomic Era. Arch Pathol Lab Med. 2019; 143:695–704. https://doi.org/10.5858/arpa.2018-0329-RA [PubMed]
- 28. Kaufman DS, Shipley WU, Feldman AS. Bladder cancer. Lancet. 2009; 374:239–49. https://doi.org/10.1016/S0140-6736(09)60491-8 [PubMed]
- 29. Bindea G, Mlecnik B, Tosolini M, Kirilovsky A, Waldner M, Obenauf AC, Angell H, Fredriksen T, Lafontaine L, Berger A, Bruneval P, Fridman WH, Becker C, et al. Spatiotemporal dynamics of intratumoral immune cells reveal the immune landscape in human cancer. Immunity. 2013; 39:782–95. https://doi.org/10.1016/j.immuni.2013.10.003 [PubMed]
- 30. Colegio OR, Chu NQ, Szabo AL, Chu T, Rhebergen AM, Jairam V, Cyrus N, Brokowski CE, Eisenbarth SC, Phillips GM, Cline GW, Phillips AJ, Medzhitov R. Functional polarization of tumour-associated macrophages by tumour-derived lactic acid. Nature. 2014; 513:559–63. https://doi.org/10.1038/nature13490 [PubMed]
- 31. Moore RJ, Owens DM, Stamp G, Arnott C, Burke F, East N, Holdsworth H, Turner L, Rollins B, Pasparakis M, Kollias G, Balkwill F. Mice deficient in tumor necrosis factor-alpha are resistant to skin carcinogenesis. Nat Med. 1999; 5:828–31. https://doi.org/10.1038/10552 [PubMed]
- 32. Canli O, Nicolas AM, Gupta J, Finkelmeier F, Goncharova O, Pesic M, Neumann T, Horst D, Lower M, Sahin U, Greten FR. Myeloid Cell-Derived Reactive Oxygen Species Induce Epithelial Mutagenesis. Cancer Cell. 2017; 32:869–83.e5. https://doi.org/10.1016/j.ccell.2017.11.004 [PubMed]
- 33. Goswami S, Sahai E, Wyckoff JB, Cammer M, Cox D, Pixley FJ, Stanley ER, Segall JE, Condeelis JS. Macrophages promote the invasion of breast carcinoma cells via a colony-stimulating factor-1/epidermal growth factor paracrine loop. Cancer Res. 2005; 65:5278–83. https://doi.org/10.1158/0008-5472.CAN-04-1853 [PubMed]
- 34. Wyckoff J, Wang W, Lin EY, Wang Y, Pixley F, Stanley ER, Graf T, Pollard JW, Segall J, Condeelis J. A paracrine loop between tumor cells and macrophages is required for tumor cell migration in mammary tumors. Cancer Res. 2004; 64:7022–29. https://doi.org/10.1158/0008-5472.CAN-04-1449 [PubMed]
- 35. Hernandez L, Smirnova T, Kedrin D, Wyckoff J, Zhu L, Stanley ER, Cox D, Muller WJ, Pollard JW, Van Rooijen N, Segall JE. The EGF/CSF-1 paracrine invasion loop can be triggered by heregulin beta1 and CXCL12. Cancer Res. 2009; 69:3221–27. https://doi.org/10.1158/0008-5472.CAN-08-2871 [PubMed]
- 36. Dalton S. Linking the Cell Cycle to Cell Fate Decisions. Trends Cell Biol. 2015; 25:592–600. https://doi.org/10.1016/j.tcb.2015.07.007 [PubMed]